CO2 Emissions and Their Relationship with Population and Forest Loss in Peru, 1990-2023
Emissões de CO₂ e a sua relação com a população e a perda florestal no Peru,
1990-2023
Las emisiones de CO₂ y su relación con la población y la deforestación en Perú,
1990-2023
DOI: https://doi.org/10.57188/rieca.2026.005
Herbert Mariano Ignacio Rodríguez Ludeña * ORCID: https://orcid.org.0000-0001-6893-0923
Daniel Francisco Castro Navarrete * ORCID: https://orcid.org.0009-0007-6138-5038
Universidad Privada del Norte, Faculty of Economics, Trujillo, Peru; Universidad Nacional de la Frontera, Sullana, Peru.
How to cite:
Rodríguez, H. y Castro, D. (2026). CO2 Emissions and Their Relationship with Population and Forest Loss in Peru, 1990-2023. RIECA,
1(1). e-005. https://doi.org/10.57188/rieca.2026.005
ABSTRACT
The general objective of this research is to determine the relationship between population and forest loss with CO2 emissions in Peru during the period 1990-2023. Empirical evidence shows that economic growth and technology have a significant relationship with toxic gas emissions worldwide; this effect is compounded by population growth, indiscriminate deforestation, and industrialization. The methodology used corresponds to a quantitative, non-experimental, longitudinal trend study supported by the Kaya Identity model. An ARDL econometric model, the bounds test, the error correction model, and the Granger causality test were applied to determine the degree of relationship, causality, and long-run cointegration among the variables. The results show that the variables cointegrate in the long run at an annual adjustment speed of 72%. In addition, the population and forest-loss variables show positive impacts of 13.5% and 0.108%, respectively. Therefore, the study concludes that CO2 emissions in Peru are directly related to population and forest loss.
Keywords: Greenhouse Effect; Global Warming; Economic Growth; Population; Forest Loss.
JEL Code: Q50, Q51, Q52, Q53, Q57, Q58.
RESUMO
O objetivo geral desta pesquisa é determinar a relação entre o crescimento populacional, a perda florestal e as emissões de CO₂ no Peru durante o período de 1990 a 2023. Evidências empíricas demonstram que o crescimento econômico e a tecnologia apresentam uma relação significativa com as emissões de gases tóxicos em todo o mundo; esse efeito é agravado pelo crescimento populacional, pelo desmatamento indiscriminado e pela industrialização. A metodologia utilizada corresponde a um estudo de tendências longitudinal, quantitativo e não experimental, apoiado pelo modelo da Identidade de Kaya. Um modelo econométrico ARDL, o teste de limites, o modelo de correção de erros e o teste de causalidade de Granger foram aplicados para determinar o grau de relação, causalidade e cointegração de longo prazo entre as variáveis. Os resultados mostram que as variáveis se cointegram no longo prazo a uma velocidade de ajuste anual de 72%. Além disso, as variáveis população e perda florestal apresentam impactos positivos de 13,5% e 0,108%, respectivamente. Portanto, o estudo conclui que as emissões de CO₂ no Peru estão diretamente relacionadas à população e à perda florestal.
Palavras-chave: Efeito Estufa; Aquecimento Global; Crescimento Econômico; População; Perda Florestal.
INTRODUCTION
The background of the research topic is presented in Table 1. The information obtained makes it possible to integrate the statistical results with the conclusions of other authors. The publications considered for this work were collected from reliable sources, particularly Scopus, and only from recent years. The research problem is formulated as follows: What is the relationship between population, economic growth, destroyed forests, and CO2 emissions? The Kaya Identity model was adopted as the theoretical reference.
In all cases, a significant relationship is observed between CO2 emissions and economic growth. Other variables studied include population, industry, and technology; in every case, they are directly related to environmental pollution. The objective of this research is to determine the relationship between CO2 emissions and the variables included in the Kaya Identity model as a reference for the econometric model. The specific objectives are to determine the relationship between the control variables and CO2 emissions. The control variables are GDP per capita, population, industrialization per capita, and destroyed forests, while the dependent variable is CO2 emissions.
Table 1. Empirical evidence from studies related to the research topic
|
Author |
Variables |
Results |
Conclusions |
|
Baena (2021) |
DV: Pollution; IV: ecosystem; IV2: environmental education |
Human beings carry out multiple activities that are necessary to improve economic conditions and social life; however, these activities affect the environment of living beings. |
The author concludes that human beings are the main agents of environmental pollution; each individual contributes through their actions to the destruction of the environment. |
|
Wang et al. (2026) |
DV: CO2; IV1: wastewater, GDP |
Greenhouse gas emissions represent a major structure in the globalized world. Wastewater treatment is fundamental for environmental conservation. |
Population and the economic level are fundamental drivers of higher emissions. Other factors include climate, geography, knowledge, and the psychological conditions of the population. |
|
Anwar (2026) |
DV: CO2 emissions; IV: energy, productivity |
Econometric methods were used for data analysis and to determine the effects of variables on agriculture, industry, and services. |
There is a relationship between CO2 emissions and agriculture; in industry the effect is negative, while services show no significant effect. The use of renewable energy is fundamental for protecting the planet. |
|
Ricapa (2020) |
DV: carbon footprint; IV: population growth |
Results based on information provided by INEI confirm the relationship between population growth and carbon footprint. |
Population growth not only has a direct impact on gas emissions but also on waste accumulation and the degradation of cultivated fields. |
|
Adebayo (2026) |
DV: CO2; IV: technology, industry |
China has made major advances in innovation, industry, and technology, but this progress has not yet translated into lower gas pollution. |
Economic growth and urbanization directly influence the increase in polluting gas emissions; the solution depends on the policies adopted by governments. |
|
Erwinsyah (2025) |
DV: gas emissions; IV: GDP, industrialization, energy consumption |
Indonesia is analyzed due to its high industrialization and production consumption; despite this, the country is making substantial efforts to reduce environmental damage. |
Industrial development involves large emissions of polluting gases. Sustainable economic growth requires clean technologies, renewable energies, and public awareness. |
|
Amaya & Paredes (2025) |
DV: economic growth; IV: energy consumption, CO2 emissions |
A relationship exists among the study variables, implying deterioration in the country’s sustainable growth. |
The causal relationship among the variables is not highly significant in the short run; the effect among variables is transitory. |
|
Segura et al. (2021) |
DV: CO2 emissions; IV: GDP |
A relationship is evidenced between CO2 and N2O emissions and GDP, using panel data for the statistical analysis. |
The results present an inverted U-shaped relationship; however, some tests show very low decreasing returns. |
|
Nisamudheen & Shreef (2026) |
DV: CO2; IV: GDP, population, terms of trade |
India has high consumption of fossil fuels and seeks a transition to non-renewable energies by 2070. |
Population and economic growth have been the most important obstacles to expanding renewable energy; green finance is promoted for clean development. |
|
Rahman & Salimullah (2026) |
DV: environmental pollution; IV: GDP, population, exports |
The use of green energy significantly reduces environmental pollution. |
A 1% increase in green energy would reduce environmental pollution by -1.18. Exports and population significantly affect long-run pollution. |
|
Mohammad et al. (2026) |
DV: CO2; IV: education, green technology, clean energy |
Greater attention to education and the use of clean energy significantly reduce CO2 emissions; modern econometric techniques are used. |
Economic growth, population growth, and the green economy are directly related to higher CO2 emissions. If human capital improves and technology is properly used, the long-run effect could be reversed. |
|
Hasanzadeh et al. (2026) |
DV: CO2; IV: population, electricity consumption |
Population and industrial growth directly affect the environment; renewable fuels are therefore necessary. |
The use of biogas significantly reduces environmental damage. Technology in general could be a major ally in reducing pollution effects. |
METHODOLOGY
Approach. The study is quantitative because it measures phenomena through statistical analysis. Hypothesis tests are also carried out together with the theoretical review in order to produce a study with scientific value.
Design. Because the data are not intentionally modified, the study follows a non-experimental design. The variables occur naturally and are observed in their existing state; there is no control over them and, in some cases, their effects have already occurred. The research only records what is observed.
Scope. Based on its characteristics, the study is longitudinal; that is, it identifies changes in variables over time. More precisely, it is a longitudinal trend study (Hernandez, 2016).
Population and sample. The population is the totality of the elements under study, also called the universe (Arias-Gonzales, 2021). The sample is a figure or number that represents the population. In this case, the population or universe is the Peruvian economy, and the sample is composed of GDP, population, and CO2 emissions during the period under analysis.
Table 2. Information sources for the model variables
|
Variable |
Period |
Source |
Code |
Symbol |
|
GDP per capita (2010 US$) |
1990-2023 |
World Bank |
NY.GDP.PCAP.KD |
GDPpc |
|
Population |
1990-2023 |
World Bank |
SP.POP.TOTL |
Population |
|
Lost forests |
1990-2023 |
Ministry of Environment |
PER.BOS.AMAZ |
Forestloss |
|
CO2 emissions |
1990-2023 |
World Bank |
EN.GHG.ALL.CE.PE |
CO2T |
|
Industrialization per capita (2010 US$) |
1990-2023 |
World Bank |
NV.IND.MANF.KD |
Induspc |
Sampling type, data-collection techniques, and instrument. The data used in this research were documentary in nature and were collected from reliable sources such as World Bank macrodata. The sampling type is referred to as "other quantitative methods of data collection" (Hernandez, 2016). The data-collection technique was documentary data acquisition, and the instrument was based on the collection of secondary data.
Timeframe, inclusion criteria, and exclusion criteria. Data were collected from the World Bank and MINAM for the 1990-2023 period. The variables included are those identified in the theoretical foundations and in models used by other authors as references for this study. As an exclusion criterion, information after 2023 was not considered because reliable statistical data were not available.
Figure 1 presents the study variables and their trend in Peru during 1990-2023. The temporal delimitation runs from 1990 to 2023. During this period, a constant growth trend is observed; however, in 2020, the trend is negative because of the COVID-19 pandemic. Nevertheless, population maintained a positive trend that year. It is also important to note that the trends described by GDP per capita and industrialization per capita are very similar, indicating that production and economic activity in general maintained sustained growth. CO2 emissions describe a trend very similar to the variables previously mentioned.
Figure 1. Study variables and trend in Peru, 1990-2023
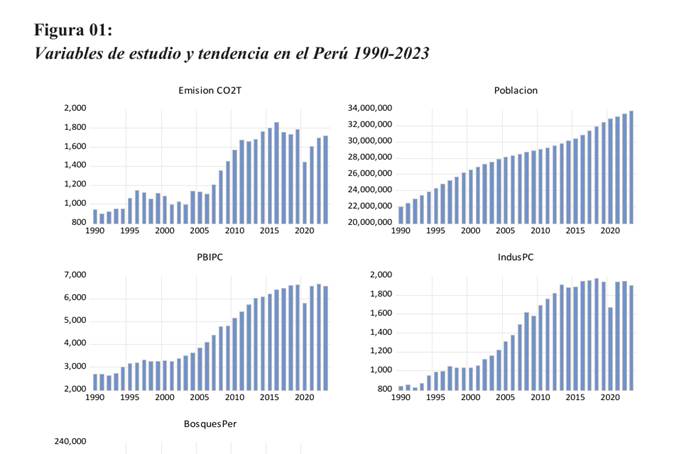
Note. The graph represents all variables in this research and describes their trend during the study period using World Bank and MINAM data.
Data collection and analysis procedure. The procedures adopted facilitate the identification of relationships and causality among variables. In summary, unit-root tests, the ARDL model, the bounds test, the error correction test, the Granger causality test, the CUSUM test, and the squared CUSUM test were used. These statistical tests made it possible to verify the validity of the variables and the application of the models using EViews 12. The study variables are represented by the following stylized facts.
CO2 emissions in Peru grew by 2.44% compared with the previous year. In 2023, Peru ranked 131st among countries with the highest emissions in the world, with the largest polluter occupying position 184. The World Bank indicates that population is the most important variable to consider; the country emits 0.11 kilograms of CO2 per US$1,000 of GDP, and its trend increases steadily over time.
The population in Peru has maintained an upward trend. By 2023, 59% of the population resided on the coast, 28% in the highlands, and 14.2% in the jungle. It is estimated that by 2050 the population will exceed 39 million inhabitants. The fertility rate was 1.98 children per woman, and the average age was 33.6 years, suggesting that the country has begun a process of population ageing.
The trend in economic growth, represented by GDP per capita, is volatile and shows four cycles with moderate variability. The end of terrorism and the economic measures of the Fujimori government allowed sustained growth up to the present. Monetary policy protects the country from inflation; the economic chapter of the 1993 Constitution had a significant impact, and mining remains one of Peru’s strengths.
The industrialization process in Peru has not received adequate incentives, and initially there was no venture capital. Industrial policy has been inefficient; however, in the last five years substantial investments have been allocated to transport, education, sanitation, and agroindustry. Peru has adopted a set of measures to promote knowledge and capabilities as part of industrial policy.
Forest loss in 2023 amounted to 132,216 hectares. The total area of current forests was 67,654,122 hectares, and forest loss was 10% lower than in the previous year. Junin, Huanuco, Puno, and Cuzco are the regions where forest area continues to decline, most often as a result of human intervention in nature.
Figures 2-6. Statistical data for the study variables in Peru, 1990-2023
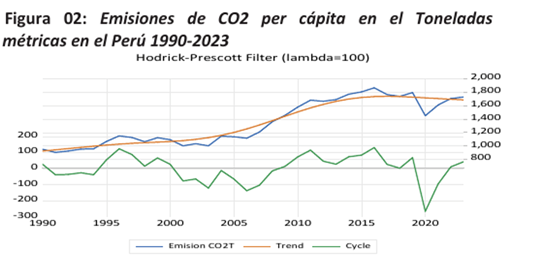
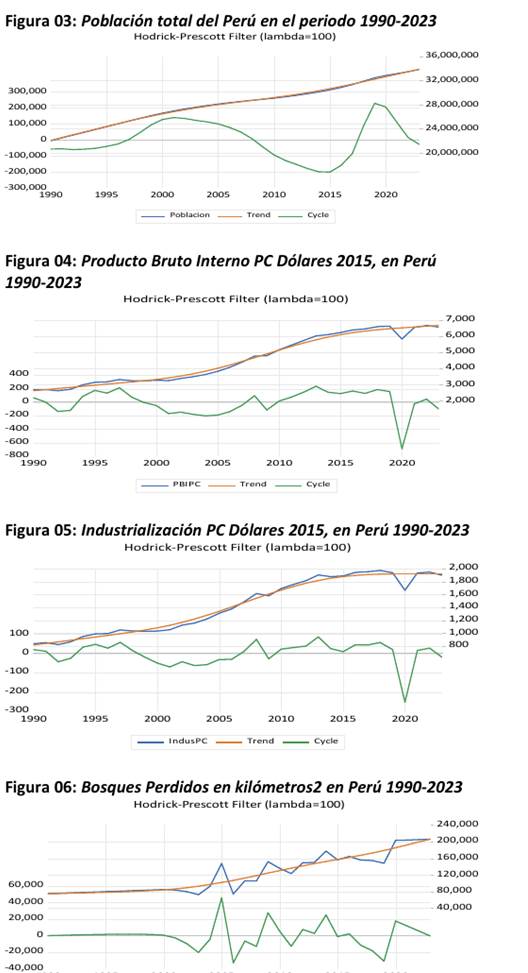
Note. Figures 2, 3, 4, 5, and 6 represent statistical data for the variables in Peru during the study period, using information from the World Bank and the Ministry of Environment (MINAM, 2024).
THEORETICAL MODEL
Among the theories that support this research, it is necessary to consider Romanian economist Nicholas Georgescu-Roegen, who proposed the law of entropy and the economic process. His approach is based on replacing the "fossilist" economy, as he called it, with a process that is careful with the environment, avoids resource depletion, and demands perpetual growth that respects nature. Technology, politics, aesthetics, and, above all, ethics must be used responsibly (Bonifetti, 2025).
Herman Daly also expressed concern about economic growth and the environmental damage it generates. His critique focuses on the need to achieve sustainability through a steady-state economy supported by institutions capable of modifying the particular structure of the economic system. Daly’s policy proposals and approaches remain relevant today (Hernan, 2026).
To establish the relationship between the growth of human activities and their effects on the environment, Kaya (1989) proposed a model explaining this phenomenon through three variables: population (P), economic growth or consumption (A), and technology (T). Thus, the model is expressed as: I = P + A + T, where I represents environmental impact. A reduction in any of the variables would directly affect polluting gas emissions (Rivas et al., 2020). Considering the reference model, the empirical evidence presented in Table 1, and the variables included in this research, the following theoretical-mathematical model is formulated: I = P + A + T + FL.
In this formulation, I represents CO2 emissions, P represents total population, A represents GDP per capita, T represents industrialization per capita, and FL represents destroyed forests. The econometric model is: CO2 = Population x GDPpc x INDUSTpc x Forestloss.
RESULTS
3.1. Unit-root test of the study variables
The Dickey-Fuller and Phillips-Perron tests were applied to determine whether the variables are stationary and integrated of order one. If they had been integrated of order two, they would not have been valid; this was verified through the results of these tests (Pereira et al., 2025).
Table 3. Summary of unit-root tests
|
Variable |
ADF level intercept |
ADF level intercept+trend |
ADF first difference |
PP level intercept |
PP level intercept+trend |
PP first difference |
|
Log CO2 emissions pc |
-0.824 |
-1.920 |
-6.106*** / -6.009*** |
-0.804 |
-2.083 |
-0.692*** / -6.016*** |
|
Log population |
-2.369 |
-4.011** |
-3.032** / -3.458* |
-0.975 |
-2.032 |
-1.372 / -1.880 |
|
Log GDPpc |
-0.301 |
-3.448* |
-6.423*** / -6.302*** |
-2.556 |
-2.077 |
-6.399*** / -6.282*** |
|
Log Induspc |
-0.887 |
-3.475* |
-6.806*** / -6.743*** |
-0.861 |
-1.778 |
-6.820*** / -6.837*** |
|
Log Forestloss pc |
-0.171 |
-4.292*** |
-9.018*** / -6.094*** |
-0.681 |
-4.276* |
-13.53*** / -18.80*** |
Note. *** Significant at 1%, ** significant at 5%, * significant at 10%. The tests show that no variable is integrated in second differences; therefore, all variables are stationary in the required order and model application is feasible.
3.2. Number of lags according to Schwarz, Akaike, and Hannan-Quinn criteria
Table 4. Lags according to Schwarz, Akaike, and Hannan-Quinn criteria
|
Variable |
Schwarz |
Akaike |
Hannan-Quinn |
|
Log(CO2 emissions pc) |
2.3481 (1) |
2.4406 (1) |
2.4105 (1) |
|
Log(Population) |
-10.256 (3) |
-10.441 (3) |
10.381 (3) |
|
Log(GDPpc) |
-3.2885 (1) |
-3.3811 (1) |
-3.3509 (1) |
|
Log(Induspc) |
-3.0125 (1) |
-3.1051 (1) |
-3.0749 (1) |
|
Log(Forestloss pc) |
-0.3778 (2) |
-0.5244 (3) |
-0.4317 (2) |
The Schwarz, Akaike, and Hannan-Quinn criteria show that the optimal number of lags averages two. Consequently, the two-lag criterion was used in the ARDL test.
3.3. ARDL model
The ARDL model analyzes time series by identifying relationships among variables with lagged and contemporary values. The bounds test verifies the long-run relationship, and the error correction model then verifies cointegration (Dahir et al., 2026).
Table 5. ARDL model
|
Variable |
Coefficient |
t-statistic |
Prob. |
|
LOG(CO2 emissions(-1)) |
0.271063 |
2.344198 |
0.0285 |
|
LOG(Population) |
13.50542 |
1.839741 |
0.0793 |
|
LOG(Population(-1)) |
-37.59606 |
-2.444724 |
0.0230 |
|
LOG(Population(-2)) |
23.44145 |
2.589865 |
0.0167 |
|
LOG(GDPpc) |
1.857445 |
2.694717 |
0.0132 |
|
LOG(Induspc) |
-1.112319 |
-1.707653 |
0.1018 |
|
LOG(Forestloss) |
-0.002754 |
-0.045178 |
0.9644 |
|
LOG(Forestloss(-1)) |
-0.092000 |
-1.380932 |
0.1812 |
|
LOG(Forestloss(-2)) |
-0.108580 |
-1.497764 |
0.1484 |
|
C |
11.33081 |
2.848362 |
0.0093 |
R = 0.9789; R2 = 0.9703; Durbin-Watson = 2.35.
The values R = 0.9789 and adjusted R2 = 0.9703 indicate a high goodness of fit. The Durbin-Watson value of 2.35 shows no serial autocorrelation. The Jarque-Bera test value of 0.74 indicates normal distribution; the LM test value of 0.20 shows absence of serial correlation; and the ARCH test value of 0.74 > 0.05 indicates no heteroscedasticity. The Ramsey test value of 0.303 shows that the model is correctly specified.
3.4. Bounds test
The validity of the bounds test is achieved when the F-statistic exceeds the critical values for the selected significance levels. In this research, the F-statistic is 9.63, while the 10% significance range is between 2.20 and 3.09; therefore, the variables jointly cointegrate.
Table 6. Bounds test
|
Variable |
F-statistic |
At 1% |
At 5% |
At 10% |
Result |
|
Akaike model |
9.630 |
1%: 3.29-4.37 |
5%: 2.56-3.49 |
10%: 2.20-3.09 |
Cointegrate |
The long-run coefficients show constants and trends. The population variable has a significance level of 0.02, below 5%, while GDP per capita has a significance level of 0.01, significant at 1%.
Table 7. Long-run restrictions, constants, and trends
|
Variable |
Coefficient |
t-statistic |
Prob. |
|
LOG(Population) |
-0.890601 |
-2.336380 |
0.0290 |
|
LOG(GDPpc) |
2.548155 |
2.723900 |
0.0124 |
|
LOG(Induspc) |
-1.525946 |
-1.691352 |
0.1049 |
|
LOG(Forestloss) |
-0.278946 |
-1.372325 |
0.1838 |
|
C |
15.54429 |
2.820751 |
0.0100 |
3.5. Error correction coefficient analysis
Error correction coefficients are expected to be negative and statistically significant in order to determine the long-run relationship among variables. They also validate long-run causality (Ahmed, 2026).
Table 8. Error correction coefficient analysis
|
Variable |
Coefficient |
t-statistic |
Prob. |
|
DLOG(Population) |
13.50541 |
2.912458 |
0.0081 |
|
DLOG(Population(-1)) |
-23.44145 |
-5.023886 |
0.0000 |
|
DLOG(Forestloss) |
-0.002754 |
-0.068286 |
0.9462 |
|
DLOG(Forestloss(-1)) |
0.108580 |
2.728403 |
0.0123 |
|
CointEq(-1)* |
-0.728937 |
-8.421034 |
0.0000 |
The coefficient CointEq(-1) has a value of -0.728 and is statistically significant at 0.000. Under these conditions, the model requirements are satisfied because the coefficient is negative and significant. Therefore, a long-run relationship exists among the variables, and they cointegrate at a maximum annual adjustment speed of 72%.
The variables with the greatest significance are contemporaneous population, with a positive impact of 13.5% and statistical significance, and forest loss with a lag, which also has a positive impact of 0.108% and is statistically significant. It should be noted that lagged population is statistically significant but has a negative impact of -23.4%. The other variables in the model do not have significant values for explaining cointegration. Finally, the high significance of population in relation to CO2 emissions in Peru should be emphasized.
3.6. Granger causality test
Table 9. Granger causality test
|
Null hypothesis |
F-statistic |
Prob. |
|
LOG(Population) does not Granger-cause LOG(CO2 emissions) |
3.97453** |
0.0307 |
|
LOG(CO2 emissions) does not Granger-cause LOG(Population) |
7.26391*** |
0.0030 |
|
LOG(GDPpc) does not Granger-cause LOG(CO2 emissions) |
3.18744** |
0.0572 |
|
LOG(Induspc) does not Granger-cause LOG(CO2 emissions) |
3.99763** |
0.0301 |
|
LOG(CO2 emissions) does not Granger-cause LOG(Induspc) |
2.59898* |
0.0928 |
|
LOG(GDPpc) does not Granger-cause LOG(Population) |
7.73966*** |
0.0022 |
|
LOG(Population) does not Granger-cause LOG(GDPpc) |
6.52511*** |
0.0049 |
|
LOG(Induspc) does not Granger-cause LOG(Population) |
6.35259*** |
0.0055 |
|
LOG(Population) does not Granger-cause LOG(Induspc) |
7.44792*** |
0.0027 |
|
LOG(Forestloss) does not Granger-cause LOG(Population) |
7.65474*** |
0.0023 |
|
LOG(Population) does not Granger-cause LOG(Forestloss) |
2.79502* |
0.0788 |
|
LOG(Induspc) does not Granger-cause LOG(GDPpc) |
2.78602* |
0.0794 |
|
LOG(GDPpc) does not Granger-cause LOG(Induspc) |
2.57635* |
0.0946 |
|
LOG(GDPpc) does not Granger-cause LOG(Forestloss) |
6.92306*** |
0.0037 |
|
LOG(Induspc) does not Granger-cause LOG(Forestloss) |
4.97248** |
0.0145 |
Note. *** Significant at 1%, ** significant at 5%, * significant at 10%.
The Granger test shows that population and CO2 emissions have a bidirectional causal relationship, as do industrialization and CO2 emissions. GDP per capita and population also present bidirectional causality, as do industrialization and population, forest loss and population, and industrialization and GDP per capita. GDP per capita and CO2 emissions, GDP per capita and forest loss, and industrialization and forest loss present unidirectional causality.
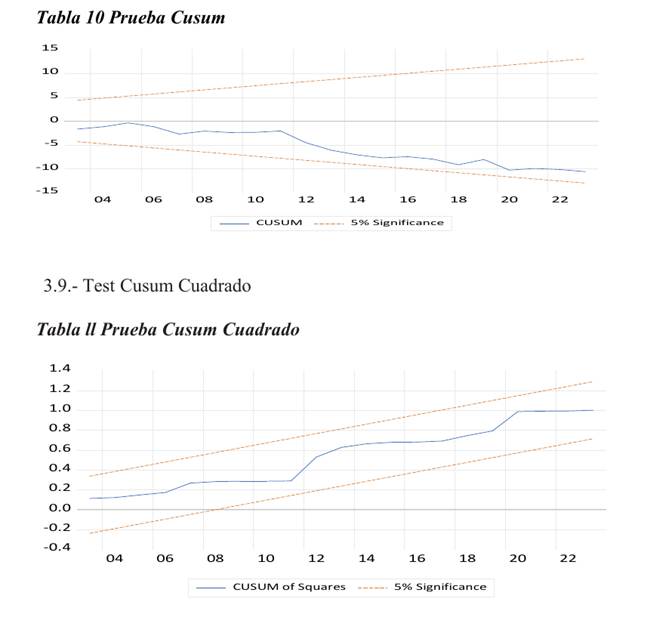
3.7. CUSUM and squared CUSUM tests
The CUSUM graph is used to detect the incidence of events or other causes in the statistical monitoring of the process. In this study, the CUSUM test shows stability in the proposed model and in its parameters because the trace does not exceed the 5% significance bands. The squared CUSUM test is an alternative measure based on squared residuals; it verifies whether non-random deviations exist from the mean. In this study, the variations in the trace do not exceed the restrictive limits of the significance bands.
Tables 10 and 11. CUSUM and squared CUSUM tests
 DISCUSSION
The relationship among population growth, larger areas of destroyed forests, and CO2 emissions in Peru during 1990-2023 is the central topic of this research. The study seeks to identify relationships among variables, their causality, and cointegration through an ARDL model (Paija et al., 2026), using the Kaya Identity as the theoretical reference.
The R value of 0.9789 and adjusted R2 of 0.9703 indicate goodness of fit. Therefore, the variables included in the model explain the impact on the dependent variable. In addition, the R and adjusted R2 values show that the error term has an imperceptible or null value in the construction and explanation of the model (He, 2026). The Jarque-Bera test value of 0.74 indicates normal distribution; the LM test shows absence of serial correlation with a value of 0.20; and the ARCH test shows no heteroscedasticity because its value is 0.74 > 0.05. The Ramsey test value of 0.303 confirms that the model is correctly specified.
The Granger causality test showed a bidirectional relationship between population and CO2 emissions; industrialization and CO2 emissions; GDP per capita and population; industrialization and population; forest loss and population; and industrialization and GDP per capita. In addition, GDP per capita and CO2 emissions, GDP per capita and forest loss, and industrialization and forest loss present unidirectional causality.
The empirical evidence presented demonstrates a high degree of relationship between CO2 emissions and population, supported by the studies of Baena (2021), Nisamudheen and Shreef (2026), Ricapa (2020), Wang et al. (2026), and Rahman and Salimullah (2026). The relationship between CO2 emissions and forest loss is supported by Anwar (2026) and Mohammad et al. (2026). Therefore, the relationship between the dependent variable and the independent variables proposed in this study is evident, reinforced by the statistical data presented in the methodological section and by the stylized facts of the model.
The theoretical foundations of this research are consistent with the findings. Nicholas Georgescu-Roegen’s model expresses concern about economic growth and environmental damage, arguing for a careful process that prevents resource depletion and respects nature, supported by ethics, technology, and policy. Herman Daly’s postulates seek to minimize environmental damage resulting from economic growth through sustainability and institutional support. The Kaya Identity model proposes economic growth, population, and technology as variables explaining the increase in CO2 emissions. In this research, these variables are particularly important based on empirical evidence and statistical testing.
The statistical analysis for the bounds test shows that the F-statistic is 9.63, exceeding the 10% lower and upper critical bounds of 2.20 and 3.09. This result shows that all variables in the model jointly cointegrate in the long run. In the error correction model, the CointEq(-1) coefficient is -0.72, fulfilling the condition of being negative and statistically significant (0.000), with a t-statistic of -8.42. These results show that the variables cointegrate until reaching long-run equilibrium, with an adjustment speed of 72% per year.
The contemporaneous population variable has a positive impact of 13.5% and is statistically significant (0.00). The lagged forest-loss variable has a positive impact of 0.108% and is statistically significant (0.01). In contemporaneous form, forest loss is not statistically significant. On the other hand, lagged population has a negative impact of -23.44% and is statistically significant (0.00). This result can be explained by the findings of Musse et al. (2026), who conclude that population has an inverse relationship with CO2 emissions when political instability prevents the population from accessing renewable energy sources.
The CUSUM and squared CUSUM tests show graphically that in both cases the traces do not exceed the 5% significance bands. Therefore, stability exists among the estimated model parameters. Since the traces do not exceed the significance bands, it is not necessary to explain any structural break or out-of-band phenomenon over time for the variables presented.
According to the Kaya Identity model used as the theoretical reference for the mathematical and econometric model, population is a variable that explains the increase in CO2 emissions. This is supported by the statistical procedures applied and by evidence from other authors. It is also necessary to include the destroyed-forests variable as a cause of CO2 emissions in Peru, whose significance values were determined with scientific rigor.
CONCLUSIONS
• This research used the ARDL model and determined that the variables in the proposed model cointegrate in both the short and long run. The population variable explains CO2 emissions in Peru during the study period with the greatest significance. The forest-loss variable also explains emissions of these polluting gases. Population growth has a major impact on the environment; countries such as Russia, China, the United States, and India are among the largest producers of carbon dioxide. Activities generated by the population - including energy demand, transport, industry, and consumption - as well as the burning of forests for agriculture and logging for industry, substantially influence the increase in CO2 emissions.
• The error correction model shows that the CointEq(-1) coefficient meets the required specifications because it is negative (-0.72) and highly significant (0.000). These results confirm the existence of a short- and long-run relationship and indicate that the variables cointegrate at an annual adjustment speed of 72%.
• Economic growth, represented by GDP per capita, has a value of 2.52 and a significance level of 0.02 in the long run. This is explained by the many activities generated in production. Over time, the growth trend is similar to the trend described by CO2 emissions. However, technology applied to the economy may eventually enable cleaner emissions in production processes.
• Industrialization in the short and long run has not shown coefficients of sufficient value or significance to affect CO2 emissions. Nevertheless, the statistical procedures show that in the long run this variable and the other variables in the econometric model will cointegrate at the speed indicated by CointEq(-1), since the conditions for its application are satisfied.
• Finally, considering the results obtained through the statistical models, the findings and conclusions of the reviewed studies, and the theoretical foundations of recognized economists who developed mathematical models to explain the research problem, it is concluded that the hypothesis that population growth and forest loss in Peru explain the increase in CO2 emissions cannot be rejected and can be accepted.
REFERENCES
Adebayo, T. (2026). Exploring the effects of ICT, financial institutions and market access on CO2 emissions: insights from time-varying frequency quantile regression analysis. Springer, 72(12), 26. https://doi.org/https://link.springer.com/article/10.1186/s40854-025-00893-7
Ahmed, H. (2026). Dynamics among term spread, stock-market volatility forecasting, financial-market risk, and oil price: an empirical analysis. Springer Open, 12(24), 26. https://doi.org/https://link.springer.com/article/10.1186/s40854-025-00862-0
Amaya, C., & Paredes, J. (2025). Analisis de un modelo VAR del consumo de energia, emisiones del CO2 y desarrollo financiero, gastos de gobierno y desarrollo economico en Honduras. LACCEI 25 - Mexico, 1(23), 10.
Antúnez, A. M. C., Morales, C. E. B., & Araujo, D. R. S. (2019). La sostenibilidad global en una empresa de transporte urbano de viajeros en autobús: Estudio de caso. In Memorias del III Congreso internacional en administración de negocios internacionales (CIANI): Retos y oportunidades del desarrollo sostenible en los negocios internacionales (pp. 28-42). Universidad Pontificia Bolivariana.
Anwar, A. (2026). Energy efficiency, economic structure, and CO2 productivity in ASEAN. Springer, 21(18), 55.
Arias-Gonzales, J. (2021). Diseño y metodologia de la investigacion. University of British Columbia.
Arrieta, L. E., & Morales, C. E. B. (2024). Necesidades sociales y dimensiones del capital social: análisis de beneficiarios de Familias en Acción. Telos: Revista de Estudios Interdisciplinarios en Ciencias Sociales, 26(2), 388-407.
Baena, S. (2021). El ser humano es el mayor contaminante del mundo. Eduneuro, 7(4), 3.
Banco Mundial. (2025). Datos Macro. https://datos.bancomundial.org/pais/peru
Barrera, M. B., & Morales, C. E. B. (2025). Análisis de la percepción de la cultura tributaria en Colombia durante el periodo pospandemia. Dictamen Libre, (36), 2.
Bonifetti, C. (2025). La bioeconomia de Nicholas Georgescu-Roegen. Economia y medio ambiente, 1(1), 16.
Borja-Barrera, M., & Barragán-Morales, C. (2025). Perception analysis of tax culture in Colombia during the post-pandemic period. Dictamen Libre, (36).
Dahir, H., Jama, A., & Hassam, M. (2026). Modelling the impact of economic development, health-related factors, and political instability on life expectancy in Somalia: an ARDL approach. Springer, 23(203), 22.
Daror, H., Warsame, A., & Ahmed, Z. (2026). Shaping Somalia’s environmental sustainability: the role of institutional quality, renewable energy, economic growth, and financial globalization in load capacity factor. Nature, 16(1564), 22.
Erwinsyah, E. (2025). Revista Mexicana de Economia y Finanzas, 20(3), 19.
Espitia-Arrieta, L., Tatiana Prestan-Gómez, S., & Barragán-Morales, C. (2022). Programas de transferencias monetarias condicionadas: una comparación en América Latina frente a Familias en Acción. Dictamen Libre, (31).
García Castellanos, C. J. . (2023). Estudio simulación esfuerzos en acero AISI/SAE 1045 por medio modelación en SolidWorks. InGente Americana, 3(3), e-669. https://doi.org/10.21803/ingecana.3.3.669
Hasanzadeh, Minaei, Ghaebi, & Ebadollahi. (2026). Strategic integration of a biogas-based energy system: Enhancing efficiency and sustainability through demand-side management and batteries. Elsevier, 290(1), 30.
He, Y. (2026). Reconfiguring Korea’s dual transition: empirical insights into the role of Industry 4.0 technologies. Science Direct, 84(1), 14.
Hernan, A. (2026). Realizing an alternative political economy of sustainability. Routledge.
Hua, L., Zhuoma, G., Yumei, W., & Jianhua, Y. (2026). Mathematical modeling of GDP-linked carbon dioxide emissions: sensitivity analysis and optimal control strategy. Scopus, 4(1), 12.
Lanzal, B., Poudel, J., & Pokjarel, R. (2026). Regional economic and labor impacts of industrial decline in the forest sector: evidence from sawmill closures in Michigan. Science Direct, 178(2), 21.
Luan, M., Tavares, L., & Fochezatto, A. (2026). Spatial dynamics of per capita gross domestic product in Brazilian municipalities. Springer Nature, 75(7), 15.
Mei, Y., Zhang, W., & Shauthari, S. (2026). Carbon markets promote environmental justice in China. Scopus, 17(392), 19.
MINAM. (2024). Cobertura y perdida de bosque humedo amazonico. Reporte de cobertura.
Mohammad, Asif, Kumar, Imran, & Shewly. (2026). Education, green technology, and clean energy as indicators of sustainability and resilience in BRICS economies. Science Direct.
Morales, C. E. B., Mendoza, A. P., Barrera, M. B., & Osorio, F. M. (2024). Transformational leadership and decision-making in organizations of the Colombian Caribbean. Dictamen Libre, (34), 167-178.
Morales, C. E. B., Guarín-García, A. F., Chang-Muñoz, E. A., Villanueva-Vásquez, A., Gálvez, J. F. E., Delgado, N. A. G., & Bracho, O. C. (2025). Fuzzy-Set Qualitative Comparative Analysis to Corporate Social Responsibility Components: A Case Study from Media Print Companies in Atlántico Department of Colombia. Procedia Computer Science, 257, 1148-1153.
Morales, C. E. B., De Moya, F. E. M., Vélez, N. S., & Vargas, E. C. (2023). Innovación social: Una aproximación desde su relación con la responsabilidad social empresarial en tiempos del COVID 19. In Investigación y Desarrollo (pp. 137-150). Fondo Editorial CIIDIES.
Mudarra-Fernández, A. B., Barragán-Morales, C. E., & González-Beleño, C. (2023). La eficiencia de las empresas con marca en los hoteles de las Ciudades Patrimonio de la Humanidad consolidadas de España. Revista Ibérica de Sistemas e Tecnologias de Informação, (E60), 624-636.
Musse, O., Echchavi, A., & Mohamud, M. (2026). Foreign direct investment and political stability as determinants of renewable energy consumption in the East African Community. Scopus, 8(1), 19.
Nhat, L., & Nguyen, D. (2026). The impact of carbon taxes on non-financial sectors in Vietnam. Science Direct, 7(8), 24.
Nisamudheen, & Shreef. (2026). Assessing the role of green finance in fostering renewable energy transition and sustainable development in India. Springer Nature, 1(1), 16.
Oyadeyi, O. (2024). The velocity of money and lessons for monetary policy in Nigeria: An application of the quantile ARDL approach. Springer, 16(86), 21.
Paija, N., Khanal, G., Paija, S., & Lawaju, P. (2026). Climate change, technology, and governance: pathways to food security in Nepal. Springer Nature, 15(1), 23.
Parveen, K., Radulescu, M., & Hemlata, S. (2026). Socioeconomic assessment: insights from a longitudinal analysis. Springer, 38(7), 22.
Pereira, W., Lara, T., Andrade, A., & Seruffo, M. (2025). Bioeconomy and climate change: food insecurity scenarios in the Northern Brazilian Amazon due to crop shifts. MDPI, 14(23), 25.
Rahman, & Salimullah. (2026). Effect of economic growth, financial development, and renewable energy consumption on environmental pollution in ASEAN countries: the role of green finance and green energy. ScienceDirect, 1(1), 16.
Ricapa, B. (2020). Relacion entre el crecimiento poblacional y la huella de carbono en San Juan de Lurigancho. Universidad San Ignacio de Loyola.
Rivas, A., Ramoni, J., & Merli, O. (2020). Evaluacion del impacto del crecimiento de la actividad humana en el medio ambiente: Identidad de Kaya aplicada a Venezuela. Dialnet, 19(37), 18.
Roberto Hernandez, C. F. (2016). Metodologia de la investigacion. McGraw-Hill.
Sayibu, A., Peter, B., Onumah, J., & Sam, F. (2026). Integrating machine learning and drone technology for precision agriculture: an intelligent solution for automated irrigation and crop management. Scopus, 22(2), 19.
Segura, C., Losada, O., & Cebay, E. (2021). La curva medioambiental de Kuznets y el desarrollo sostenible en Colombia. Universidad Surcolombiana Neiva, 40(71), 24.
Supriya, G., Shashwati, W., & Sanjay, P. (2026). Patent landscape analysis on the use of artificial intelligence in carbon capture and utilization technologies. Scopus, 7(203), 12.
Turizo, J. M., Bracho, O. C. C., & Morales, C. B. (2026). General and differential mechanisms of citizen participation: Prior consultation and victims’ participation boards. Pensamiento Americano, 19(39).
Wang, Zhang, & Li. (2026). Spatiotemporal patterns and drivers of carbon emissions from on-site wastewater treatment: evidence from a long-term citywide network. Elsevier, 16(33), 21.
Yongshun, Z., Mengzhem, Z., & Shi, Z. (2026). The impact of ageing and urbanization on CO2 emissions in Chinese cities: an empirical analysis. Beijing Institute of Technology, 1(1), 17.