
INTRODUCTION
Comparación entre el Índice de Precipitación Estandarizado (SPI) y el Índice de Evapotranspiración Estandarizado (SPEI) para la sequía agrícola en el valle del Mantaro, Perú
Víctor Antonio Ángeles Clemente1; Del Piero R. Arana-Ruedas1, *; Steve Dann Camargo Hinostroza1;
Oketta Onafuje2
1 Universidad Continental, Campus Huancayo, Av. San Carlos 1980, Urb. San Antonio, Huancayo, Junín, Perú.
2 National Council on Climate Change,14 Vistula Close, off Panama Street, Maitama Abuja, Nigeria.
* Autor corresponsal: darana@continental.edu.pe (D. P. R. Arana-Ruedas).
ORCID de los autores:
V. A. Ángeles Clemente: https://orcid.org/0000-0002-2529-2068 D. P. R. Arana-Ruedas: https://orcid.org/0000-0002-3682-5405
S. D. Camargo Hinostroza: https://orcid.org/0000-0001-6814-9918 O. Onafuje: https://orcid.org/0009-0000-2856-0745
ABSTRACT
Drought is one of the main events associated to climate change that affects water supply and food productions at different locations and time (spatio-temporal) in the Peruvian Tropical Andes (PTA). Furthermore, studies evidenced that drought are causing an enormous damage to social, economic and environmental spheres. Hence, The World Meteorological Organization (WMO) has published a handbook of drought indicators and indices with the most representative methods used in the world to assess drought events, but each index has a different advantage since the requested variable and scope are different. In that sense, this study aims to compare the Standardized Precipitation Index (SPI) and Standardized Evapotranspiration Index (SPEI) for agricultural drought under spatio-temporal consideration in the PTA, Mantaro Valley. Firstly, SPI is based on precipitation data, effectively distinguishes between wet and dry seasons. Secondly, SPEI takes into consideration precipitation and temperature changes which leads to an understanding of global warming. SPI and SPEI were applied to six different meteorological stations within Mantaro Valley with data between 1990-2021 under a spatio-temporal approach. The results mainly show that, 30% reveal characteristics of drought. Also, SPEI was able to identify greater drought events by +-3% for all meteorological stations and applying the Cohen's Kappa statistical analysis, substantial but not perfect agreement can be evidenced with a no agreement value of +-40%. Finally, it is recommended to continue analyzing floods and frosts in the last decades with the purpose of clearly understand the climatic development for an informed decision making in the water management and agricultural activities.
Palabras clave: Climate Change; SPI; SPEI; Drought; Agriculture; Peru.
RESUMEN
La sequía es uno de los principales eventos asociados al cambio climático que afectan el suministro de agua y la producción de alimentos en diferentes lugares y momentos (espacio-temporales) en los Andes Tropicales Peruanos (ATP). Además, los estudios han evidenciado que la sequía está causando un enorme daño a las esferas sociales, económicas y ambientales. Por ello, la Organización Meteorológica Mundial (OMM) ha publicado un manual de indicadores e índices de sequía con los métodos más representativos utilizados en el mundo para evaluar los eventos de sequía, pero cada índice tiene una ventaja diferente ya que la variable solicitada y el alcance son diferentes. En ese sentido, este estudio tiene como objetivo comparar el Índice Estandarizado de Precipitación (SPI) y el Índice Estandarizado de Evapotranspiración (SPEI) para la sequía agrícola bajo una consideración espacio-temporal en el ATP, Valle del Mantaro. En primer lugar, el SPI se basa en datos de precipitación, distingue efectivamente entre estaciones húmedas y secas. En segundo lugar, el SPEI toma en consideración los cambios de precipitación y temperatura, lo que conduce a una comprensión del calentamiento global. Se aplicó el SPI y el SPEI a seis estaciones meteorológicas diferentes dentro del Valle del Mantaro con datos entre 1990-2021 bajo un enfoque espacio-temporal. Los resultados muestran principalmente que, el 30% revela características de sequía. Además, el SPEI fue capaz de identificar eventos de sequía mayores en un +-3% para todas las estaciones meteorológicas y aplicando el análisis estadístico Kappa de Cohen, se puede evidenciar una concordancia sustancial pero no perfecta con un valor de no concordancia de +-40%. Finalmente, se recomienda continuar analizando las inundaciones y heladas en las últimas décadas con el propósito de comprender claramente el desarrollo climático para una toma de decisiones informada en la gestión del agua y actividades agrícolas.
Palabras clave: Cambio climático; SPI; SPEI; Sequía; Agricultura; Perú.
Recibido: 12-04-2024.
Aceptado: 03-07-202.
INTRODUCTION
The exacerbated worldwide greenhouse gases emissions have driven to an undoubtedly global warming reaching 1.1°C above 1850-1900 in the las decade which, trigger human-caused climate change affecting sustainable development spheres (IPCC, 2023). In addition, environmental resources are even more sensitive due to the rapid population growth rate that face a natural condition of satisfying human needs basically linked to water supply and food production, however, are the most threatened on current climate change conditions (Mohammed et al., 2022).
Droughts is one of the main climate impact drivers that affects water supply and food productions at different locations and time (spatio-temporal) (Yu et al., 2023). Furthermore, the observed changing climate is producing variations in the duration, frequency and severity of droughts based on meteorological modified conditions (Nwayor & Robeson, 2024). It is important to mention that droughts is a natural phenomenon exacerbated by climate change which can be clearly defined as a slowly complex developing event under trend of warming conditions and lack of precipitation patterns (Arana Ruedas & Moggiano, 2023; Mousavi et al., 2023).
Furthermore, studies evidenced that drought are causing an enormous damage to social, economic and environmental spheres (Laimighofer & Laaha, 2022; Meseguer-Ruiz et al., 2024), especially in locations where agriculture represent one of the most important incomes (Singh et al., 2023) due to its extended period of time affecting water resources, food production, and the environment (Mousavi et al., 2023).
The World Meteorological Organization (WMO) has published a handbook of drought indicators and indices with the most representative methods used in the world to assess drought events sorted by requested variables and easiness application (WMO, 2016). Likewise, three of the most used indices are the Standardized Precipitation Index (SPI), Palmer Drought Severity Index (PDSI), and the Standardized Evapotranspiration Index (SPEI).
Each index has a different advantage since the requested variable and scope are different. For instance, SPI requires precipitation values; SPEI, precipitation and temperature; meanwhile PDSI, precipitation, temperature, and available water content (WMO, 2016). Nevertheless, SPI and SPEI are the most suitable indices for spatio-temporal drought assessment since PDSI has a short-time scale analysis (Arana Ruedas & Moggiano, 2023).
The spatio-temporal characteristics is crucial for drought assessments since the usable water resource varies considerably from the moment of its arrival until its use. In that sense, the accumulated water deficit for a given time scale is substantially significant (Arana Ruedas et al., 2023). On the other hand, it has been shown that also spatial consideration is relevant due to complex climate systems forced by physiographic conditions (Meseguer-Ruiz et al., 2024).
Locations with special physiographic conditions are mostly notable in megadiverse countries like Peru, which evidence 38 kind of climate according to the Servicio Nacional de Meteorología e Hidrología del Peru (SENAMHI, 2020).
There are several studies in the Peruvian Tropical Andes (PTA) and climate change revealing that geographic changes drive different climate conditions so, the PTA has a very complex climate system. These locations are populated by farmers who are in charge of supplying food to different cities in Peru. However, their livelihood has been affected by droughts (Arana Ruedas et al., 2023).
In that sense, this study aims to compare the Standardized Precipitation Index (SPI) and Standardized Evapotranspiration Index (SPEI) for agricultural drought under spatio-temporal consi-deration in the Peruvian Tropical Andes, Mantaro Valley, in order to identify the most suitable index to provide early, trusty and efficient information to farmers and water resources users.
Drought Characteristics
Drought is one of the events associated to climate change with significant implications on ecosystems all over the world and it has measurement compli-cations due to spatial and temporal variability under different characteristics of severity, duration, and frequency (Gumus, 2023; Yang et al., 2019).
Furthermore, there are four types of droughts: (i) meteorological (linked to precipitation), (ii) agri-cultural (linked to soil moisture), (iii) hydrological (linked to water storage), and socioeconomic (linked to water resources supply and social interaction) (Mupepi & Matsa, 2023; Zhu et al., 2024). Each type of drought is also linked to a specific period of time: (i) meteorological (1-3 months), (ii) agricultural (6-12 months), (iii) hydrological (24-48 months), (iv) socioeconomic (linked to previous types of droughts).
Meteorological drought is related to a short time scale since it is clearly identified due to lack of precipitation. Meanwhile, agricultural drought follows in terms of time since it takes more time for soil to release moisture. Finally, hydrological drought, takes the longest time to be identified since it is related to underground water sources which takes a considerable time to be modified (Marcos Valiente, 2001).
In addition, drought events apart from their type can be classified for its occurrence characteristics such as: frequency (periodicity of an event), severity (degree of hardness), and duration (period of permanence) (Leng et al., 2015; Vergni & Todisco, 2011; Vorobevskii et al., 2022). Figure 1 explains the interaction.
Drought indices like the Standardized Precipitation Index (SPI) or the Standardized Evapotrans-piration Index (SPEI) according to the resulting value can be sorted by severity as follows: (i) No drought, (ii) slight drought, (iii) moderate drought, (iv) severe drought and (v) extreme drought (Nam et al., 2015).
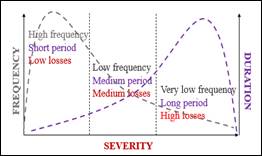
Figure 1: Drought characteristics interaction.
Spatio-Temporal Consideration
The climate system characteristics are covering worldwide areas (spatial) and constantly modifying (temporal). Therefore, academic studies must cover both elements at any assessment (Yu et al., 2023). These elements are mostly determined by natural and anthropogenic factors such as the orography in a place (Meseguer-Ruiz et al., 2024).
The events associated to climate change are not the exception since are not homogenous on Earth, varying constantly from region to region (Sharma & Goyal, 2020). For instance, drought occurrence differs in space and time due to complex topography and special climate characteristics (Yang et al., 2019).
It is referred by (Zubieta et al., 2017) that annual or seasonal precipitation data can be misinterpreted the spatio-temporal distribution, since the variable can drastically change in a short period of time; especially, in locations like the Mantaro Valley in Peru where the precipitation has been poorly investigated.
The three types of climates identified in around the Mantaro Valley using the Warren Thornthwaite's climate classification method are: (i) Rainy with dry autumn and winter (cold), (ii) Semi-dry with dry autumn and winter (cold) and (iii) Semi-dry with abundant humidity all seasons of the year (tempered) (SENAMHI, 2020). It demonstrated that in a relatively short spatio-temporal distri-bution climate differences can be identified.
In highland areas, analyzing climate fluctuation and projecting future climates are challenging (Eccel & Tomozeiu, 2015). It is critical to realize that predictions for future climate change are still uncertain (Drobinski et al., 2018), mainly in terms of precipitation patterns change (Sharma & Goyal, 2020). Additionally, the effects of climate may differ depending on altitude in locations such as the Mantaro Valley (Correa et al., 2016).
Therefore, the degree of vulnerability of a nation and its individual regions can be understood through climate variability and future climate forecasts (Bağçaci et al., 2021). Regretfully, when future climate assessment and decision-making occurs, governments typically ignore the unpre-dictability surrounding spatiotemporal variability (Wang et al., 2017).
In order to eliminate uncertainty and gain an objective understanding of regional and local climate systems, it is imperative that data be analyzed at a certain spatial resolution (Lozano-Povis et al., 2021).
METHODOLOGY
Study Area
The study was carried out in the Mantaro Valley, Peru, which belongs to the Peruvian Tropical Andes (PTA) and is composed by four provinces: Huancayo, Chupaca, Concepción and Jauja.
Furthermore, within this area, six meteorological stations (Huayao, Santa Ana, Viques, Ingenio, Jauja and Ricran) are managed by the Servicio Nacional de Meteorología e Hidrología (SENAMHI), where information of daily precipitation, minimum and maximum temperature between 1990 - 2021 were collected.
Standardized Precipitation Index (SPI)
The Standardized Precipitation Index (SPI) was proposed by (Wagesho & Claire, 2016) as an indicator which could be easy and useful for drought assessment since the technique only require one variable (precipitation) and has the capacity to be projected at different time scales.
SPI was interesting for many nations and the World Meteorological Organization (WMO) suggested the application of the index for drought monitoring considering the global need of implementing an early warning system for changing drought patterns (Hayes et al., 2011).
It has been shown that the index, which is based on precipitation data, effectively distinguishes between wet and dry seasons (Espinosa et al., 2019; Lorenzo et al., 2024). However, it is highlighted by (WMO, 2016) that SPI can be used with 20 years of data, but for time series, at least 30 years of data are advised.
Additionally, drought episodes are recognized as ongoing until the SPI value of 0 is reached, and they are indicated when the findings of SPI, during the timescale under investigation, consistently turn negative and reach a value of −1 (WMO, 2016). Nevertheless, (Wagesho & Claire, 2016) implies that there is no set standard because different academics will classify drought at different initial values. Some will use a threshold that is less than 0 but not nearly −1, while others will use values less than −1.
SPI is commonly computed for periods of up to 24 months, and its adaptability permits a variety of uses addressing occurrences impacting the agricultural, water resource, and other sectors. (WMO, 2016).
Since SPI runs with precipitation data, information is applied in the following equation (NCAR, 2024):
![]()
Where SPI is the standardized precipitation index; Pi stands for precipitation with (i) indicating the time scale (1 - 48 months); p* referring to mean precipitation; and σp is the standard deviation of precipitation.
SPI's time-scale ratio computation and ease of use are highly regarded. It offers valuable information for monitoring droughts by providing significant information about periods of wet and dry conditions. Nevertheless, since SPI is a precipi-tation index solely, it does not account temperature and evapotranspiration, making it difficult to evaluate the effects of rising temperatures (global warming) on droughts in an objective manner.
Standardized Precipitation Evapotranspiration Index (SPEI)
It is also identified in the handbook of drought indicators and indices by the World Meteorological Organization (WMO), the Standardized Precipi-tation Evapotranspiration Index (SPEI), which ope-rationally speaking comes from the Standardized Precipitation Index (SPI) but includes a temperature variable (WMO, 2016).
SPEI was developed by (Vicente-Serrano et al., 2010), where states the global need for a drought assessment taking into consideration temperature changes due to different global warming scenarios provided by international organizations such as the Intergovernmental Panel on Climate Change (IPCC).
The precipitation data, either weekly or monthly, is inputted into the SPI calculation. On the other hand, the SPEI uses the monthly or weekly difference between precipitation and potential evapotrans-piration (PET). This illustrates a fundamental climatic water balance, where temperature plays a significant role in determining drought when trends of global warming are taken into account.
Calculating SPEI the following equations were proposed (Vicente-Serrano et al., 2010):
![]()
Where PET is the potential evapotranspiration; T is the monthly-mean temperature (°C); I is a heat index; m is a coefficient depending on I: m = 6.75*10-7 I3 - 7.71*10-5 I2+1.79*10-2I + 0.492; and K is a correction coefficient computed as a function of the latitude and o month.
Afterwards, the following formula is used to determine the difference between the precipitation P and potential evapotranspiration PET for the month I (time-scale):
![]()
Subsequently, SPEI can be obtained by:
![]()
Where, ![]() for P ≤ 0.5; and P is
the probability of exceeding a determined Di value, which mathematical
fundamentals can be reviewed (Vicente-Serrano et al.,
2010), and the constants are C0
= 2.515517; C1 = 0.802853; C2 = 0.010328; d1 =
1.432788; d2 = 0.189269; and d3 = 0.001308.
for P ≤ 0.5; and P is
the probability of exceeding a determined Di value, which mathematical
fundamentals can be reviewed (Vicente-Serrano et al.,
2010), and the constants are C0
= 2.515517; C1 = 0.802853; C2 = 0.010328; d1 =
1.432788; d2 = 0.189269; and d3 = 0.001308.
Nevertheless, to make SPEI an easy technique, its calculation can be automatically done using RStudio software due to its availability of an SPEI package (Beguería et al., 2014). Finally, it is important to remark that to run SPEI calculation a complete data set is required without missing any monthly or weekly information (WMO, 2016).
Cohen's Kappa Statistical Analysis
The approach of analyzing how well different procedures or methods agree is widely used (Gwet, 2008). Therefore, Cohen's Kappa statistics are ideal for evaluating SPI and SPEI agreement in order to determine the likelihood of agreement or disagreement. Stronger agreement is indicated by high values in the statistical technique values, which range from -1 to +1. Table 1 provides specifics for each Cohen's Kappa category.
Table 1
Cohen’s Kappa Categories
|
Kappa value |
Degree of agreement |
|
<0 |
Agreement equivalent to chance |
|
0.1-0.2 |
Slight agreement |
|
0.2-0.4 |
Fair agreement |
|
0.4-0.6 |
Moderate agreement |
|
0.6-0.8 |
Substantial agreement |
|
0.8-0.99 |
Near perfect agreement |
|
1 |
Perfect agreement |
Source: Tefera et al. (2019).
RESULTS AND DISCUSSION
Standardized Precipitation Index (SPI) and Standardized Precipitation Evapotranspiration Index (SPEI) Analysis
This study is focus on agricultural drought and sorts of droughts by severity previously described which is detailed in Table 2. Furthermore, each meteorological station is analyzed for SPI and SPEI.
Table 2
SPI/SPEI Values and Severity
|
Grade |
SPI-SPEI Value |
Drought severity |
|
0 |
-0.50 < x |
No drought |
|
1 |
-1.00 < x ≤ -0.50 |
Slight |
|
2 |
-1.50 < x ≤ -1.00 |
Moderate |
|
3 |
-2.00 < x ≤ -1.50 |
Severe |
|
4 |
x ≤ -2.00 |
Extreme |
The identification of droughts regardless of their severity in any month of the years analyzed in this study will be understood as a “drought event.”
Huayao is the meteorological station belonging to the province of Chupaca and geographically located at the coordinates of longitude 75° 20' 17'' W and latitude 12° 2' 18'' S. This station analyzes meteo-rological data between the years 1990 and 2021.
It has been identified that SPEI can identify greater drought events than SPI by 3% for a time scale of 6 and 12 months between events of the various severity categories. SPEI identified drought events in 32.29% and 31.77% while SPI in 29.17% and 28.91% for a time scale of 6 and 12 months, respectively, indicating that SPEI identified drought events at a higher frequency. However, SPI identify 10 and 7 additional extreme drought events than SPEI for 6 and 12 months. On the other hand, SPEI identified 22 and 18 more events of light, moderate and severe drought than SPI for both analyzed time scales (Figure 2).
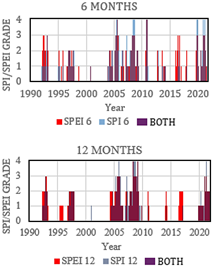
Figure 2. Agricultural Drought in Huayao station using SPI and SPEI.
Regarding drought events duration for a 6 months’ time scale, both indices were able to identify droughts for prolonged periods (from 6 continuous events) for the years 1992, 1996, 1997, 2007, 2004, 2005, 2007, 2008, 2010, 2020, 2021. Nevertheless, SPEI has 7 more drought events than SPI in 2016. Furthermore, in a 12 months’ time scale, both indices identified a continuous prolonged periods of drought between 2004 and 2009.
Santa Ana Meteorological Station
SPEI identified drought events in 29.49% and 30.45% while SPI in 26.28% and 24.36% for a time scale of 6 and 12 months, respectively, indicating that SPEI identified drought events at a higher frequency. Santa Ana is the meteorological station belonging to the province of Huancayo and geographically located at the coordinates of longitude 75° 13' 15'' W and latitude 12° 0' 15'' S. This station analyzes meteorological data between the years 1996 and 2021.
It has been identified that SPEI can identify greater drought events than SPI by 3% and 6% for a time scale of 6 and 12 months, respectively, between events of the various severity categories (Figure 3).
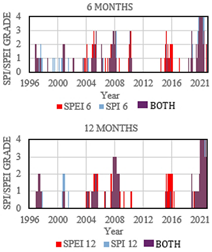
Figure 3. Agricultural Drought in Sana Ana station using SPI and SPEI.
Furthermore, SPEI got 10 and 14 additional moderate drought events than SPI for 6 and 12 months. On the other hand, there is a short different between slight, severe and extreme droughts for both analyzed time scales. Related to drought events duration for a 6 months’ time scale, SPEI and SPI identified 6 out of 26 analyzed years with the same amount of drought events being these: 1996. 2005, 2008, 2019, 2020, and 2021. Nevertheless, SPEI has 8 more drought events than SPI in 2016. Meanwhile, in a 12 months’ time scale, 2008 and 2021 showed a fully year with drought events for SPI and SPEI.
Viques Meteorological Station
Viques is the meteorological station belonging to the province of Huancayo and geographically located at the coordinates of longitude 75° 14' 7'' W and latitude 12° 09' 47'' S. This station analyzes meteorological data between the years 2003 and 2021.
It has been identified that SPEI can identify greater drought events than SPI by 1% and 3% for a time scale of 6 and 12 months, respectively, between events of the various severity categories.
SPEI identified drought events in 28.95% and 31.14% while SPI in 27.63% and 28.07% for a time scale of 6 and 12 months, respectively, indicating that SPEI identified drought events at a higher frequency (Figure 4).
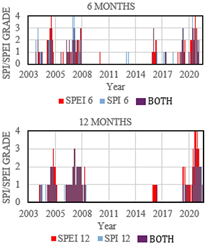
Figure 4. Agricultural Drought in Viques Station using SPI and SPEI.
Furthermore, SPEI and SPI got almost the same amount of drought events by severity. There is only one markable difference regarding extreme events for a 12 months’ time scale period where SPI did not identify any extreme drought event but, SPEI got 3 of these events.
Almost zero drought events were identified by SPEI and SPI in both time scale series between 2010 and 2015. In addition, drought events between 2003 and 2021 almost have the same deportment.
Ingenio Meteorological Station
Ingenio is the meteorological station belonging to the province of Concepcion and geographically located at the coordinates of longitude 76° 17' 16'' W and latitude 11° 52' 51'' S. This station analyzes meteorological data between the years 2002 and 2021.
It has been identified that SPEI can identify greater drought events than SPI by 3% and 2% for a time scale of 6 and 12 months, respectively, between events of the various severity categories.
SPEI identified drought events in 32.08% and 36.25% while SPI in 28.75% and 34.17% for a time scale of 6 and 12 months, respectively, indicating that SPEI identified drought events at a higher frequency. SPI identified 7 more extreme drought events than SPEI for a time scale period of 6 months but, SPEI got more events for slight, moderate and severe droughts. On the other hand, for a time scale period of 12 months events given by SPEI and SPI are almost the same with a variation of +- 2 drought events (Figure 5).
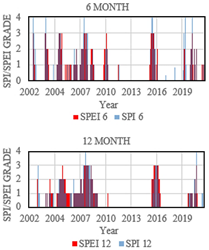
Figure 5. Agriculture Drought in Ingenio Station using SPI and SPEI.
Furthermore, drought events duration for a time scale period of 6 months has the same deportment. Regarding drought events for 12 months’ time scale period, it is notable that between 2010 and 2015 no drought prevailed.
Jauja Meteorological Station
Jauja is the meteorological station belonging to the province of Jauja and geographically located at the coordinates of longitude 75° 29' 12.8'' W and latitude 11° 47' 11.9” S. This station analyzes meteorological data between the years 1990 and 2021.
It has been identified that SPEI can identify greater drought events than SPI by 3% and 4% for a time scale of 6 and 12 months, respectively, between events of the various severity categories.
SPEI identified drought events in 32.29% and 30.73% while SPI in 29.17% and 26.56% for a time scale of 6 and 12 months, respectively, indicating that SPEI identified drought events at a higher frequency (Figure 6).
SPEI has identified 11 additional moderate drought events than SPI and regarding slight, severe and extreme, deportment is almost the same for a time scale period of 6 months. In contrast, for a 12 months’ time scale period there is a notable difference among slight, moderate and severe drought events.
In addition, drought event duration for both time scale periods evidenced a fully year of drought being this 1992, and no drought values persists between 2011 and 2015.
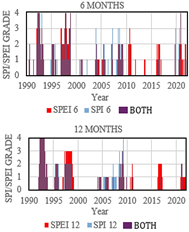
Figure 6. Agricultural Drought in Jauja Station using SPI and SPEI.
Ricran Meteorological Station
Ricran is the meteorological station belonging to the province of Jauja and geographically located at the coordinates of longitude 75° 31' 26'' W and latitude 11° 32' 22'' S. This station analyzes meteorological data between the years 2003 and 2021. It has been identified that SPEI can identify greater drought events than SPI by 2% and 3% for a time scale of 6 and 12 months, respectively, between events of the various severity categories.
SPEI identified drought events in 32.02% and 31.58% while SPI in 29.82% and 28.51% for a time scale of 6 and 12 months, respectively, indicating that SPEI identified drought events at a higher frequency (Figure 7).
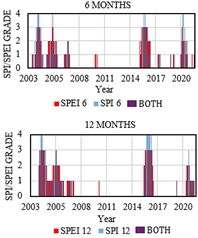
Figure 7. Agriculture Drought in Ricran Station using SPI and SPEI.
SPEI and SPI evidenced a notable difference among then in moderate, severe and extreme drought but, equal deportment in slight one for a 6 months’ time scale period. Yet, for a 12 months’ time scale drought events considerable vary among slight, moderate, severe and extreme in both indices. For instance, SPI identified 10 extreme drought and SPEI none.
Regarding drought duration for a time scale period of 6 months for SPI and SPEI, at least one drought event was identified between 2015 and 2021, being 2016 the only one with a fully year of drought events. Meanwhile, for a 12 months’ time scale period in both indexes’ drought duration were almost the same.
Comparative Statistical Analysis of SPI and SPEI
The Cohen’s Kappa statistical analysis was run for each meteorological station assessing the agree-ment level between SPI and SPEI for the same time scale series. However, it's crucial to note that the acquired continuous values of SPI and SPEI were converted to ordinal as Table 2 illustrates because Cohen's Kappa statistics perform well with ordinal or nominal values. Furthermore, Cohen’s Kappa statistics were run using SPSS software and results are shown in Table 3.
Table 3
Cohen’s Kappa for SPI and SPEI
|
Meteorological Station |
SPI 6 vs SPEI 6 |
SPI 12 vs SPEI 12 |
|
HUAYAO (1990-2021) |
0.642 |
0.628 |
|
SANTA ANA (1996-2021) |
0.619 |
0.706 |
|
VIQUES (2003-2021) |
0.588 |
0.671 |
|
INGENIO (2002-2021) |
0.669 |
0.748 |
|
JAUJA (1990-2021) |
0.548 |
0.518 |
|
RICRAN (2003-2021) |
0.732 |
0.763 |
The following is the main interpretation of the statistical results that were presented: About SPEI, SPI can duplicate the drought episodes found for a period of 6 or 12 months, as appropriate, up to a (% value obtained), and vice versa.
It is notable that most carried comparisons provide a result of substantial agreement, but three of them has a moderate agreement, which should not be ignores.
Critical Appraisal
An increasingly variable climate is posing a direct threat to the agricultural activities of farmers in the Peruvian Tropical Andes (PTA), who are already impacted by socio-economic factors and typically practice rainy season crop system (Arana Ruedas et al., 2023), which the current study validates by identifying multiple drought events in the six meteorological stations under analysis between 1990 and 2021.
To make preventive decisions and ensure that there is enough water available to meet the food demand generated by the Mantaro Valley's agricultural activities, it is critical to identify drought situations. An approximate fluctuation of +-3% between the detected drought occurrences was frequently observed in the comparison study of drought indices between the standardized precipitation index (SPI) and the standardized precipitation and evapotranspiration index under a descriptive observation.
This agrees with Singh et al. (2023), who states that the results of the comparative study between SPI and SPEI result in identical circumstances, and this agrees with Meseguer-Ruiz et al. (2024), who expresses that by showing similar patterns in the results there is little influence from a global warming perspective. Likewise, Nwayor & Robeson (2024) states that, in regions with the presence of humidity, the consideration of precipitation prevails over that of the potential for evapotrans-piration. In this sense, it could be understood in the beginning that applying SPI or SPEI over the Mantaro Valley provides very similar results, varying only in the availability of meteorological temperature information. However, when applying the inferential analysis with the Cohen's Kappa statistic, valuable information was obtained mostly indicating a substantial level of agreement between SPI and SPEI for the 6- and 12-month time scales within the 6 meteorological stations.
Consequently, it can be inferred that there is agreement between the SPI and SPEI methods between 50% and 60% for the meteorological stations analyzed over Mantaro Valley, considering that a perfect agreement in the Cohen's Kappa analysis is 100%. Hence, there is an approximate variability of 40% in the results between the indices. This variability identified by Cohen's Kappa agrees with the descriptive analysis when a focus is placed on the number of drought events by their severity, given that as manifested in the interpretation of graphs, there are meteorological stations that for SPI identify lower drought events or identify greater extreme drought events. This appreciation is shared by (Mohammed et al., 2022) who states that the identification of moderate to severe droughts depends on the method applied. Likewise, Tirivarombo et al. (2018) points out that SPI identified greater extreme drought events than SPEI.
Finally, it is important to take into consideration the identification of drought events, which were greater in SPEI, as well as the severity and duration of the same events; that are naturally aligned with changes in temperature in a spatial distribution with changing orography as in the Mantaro Valley where climate types with dry and humid characteristics are also evident.
CONCLUSIONS
It is important to note that the Mantaro Valley belonging to the Peruvian Tropical Andes (PTA) houses an important agricultural diversity that guarantees food security at the national level and generates supply internationally. In this sense, the analysis of climatic events is of vital importance to guarantee water security and reduce agricultural vulnerability of the area under a spatio-temporal approach due to the complicated orography and climate system.
By performing the comparative analysis between the standardized precipitation index (SPI) and standardized precipitation and evapotranspiration index (SPEI), it can be concluded that from all the analyzed events between 1990 and 2021, on average about 30% of these reveal characteristics of drought.
Descriptively, SPEI was able to identify greater drought events by +-3% for all meteorological stations while SPI identified greater extreme drought events than SPEI. Nevertheless, under Cohen's Kappa statistical analysis, substantial but
not perfect agreement can be evidenced, indicating a variation between the identification of drought events in consideration of severity, frequency and duration by approximately +-40%.
This variation has to be taken into consideration for the adequate implementation of adaptive measures against climate change, given that the only major difference between SPI and SPEI is the consideration of global warming using the temperature variable.
In this sense, it is recommended to apply SPEI over the Mantaro Valley to identify drought events due to its capacity of identifying major events and refine the severity characteristic of droughts under changing temperatures, as long as meteorological information is available for the variables of precipitation and temperature; Otherwise, SPI can be a good reference in identifying drought events when only precipitation information is available.
Finally, it is recommended to continue analyzing climatic events in the area related to floods and frosts with the purpose of integrating information.
REFERENCES
Arana Ruedas, D. P. R., & Moggiano, N. (2023). ENSO Influence on Agricultural Drought Identified by SPEI Assessment in the Peruvian Tropical Andes, Mantaro Valley. Manglar, 20(2), 157–167. https://doi.org/10.57188/manglar.2023.018
Arana Ruedas, D. P. R., Soto Guerra, L., Popli, K., & Gambo Madaki, S. (2023). Spatio-Temporal Drought Assessment Using Standardized Precipitation Evapotranspiration Index (SPEI) over Mantaro Valley, Peru. Revista de Investigaciones Altoandinas - Journal of High Andean Research, 25(3), 159–170. https://doi.org/10.18271/ria.2023.525
Bağçaci, S. Ç., Yucel, I., Duzenli, E., & Yilmaz, M. T. (2021). Intercomparison of the expected change in the temperature and the precipitation retrieved from CMIP6 and CMIP5 climate projections: A Mediterranean hot spot case, Turkey. Atmospheric Research, 256, 105576. https://doi.org/10.1016/J.ATMOSRES.2021.105576
Beguería, S., Vicente-Serrano, S. M., Reig, F., & Latorre, B. (2014). Standardized precipitation evapotranspiration index (SPEI) revisited: parameter fitting, evapotranspiration models, tools, datasets and drought monitoring. International Journal of Climatology, 34(10), 3001–3023. https://doi.org/10.1002/JOC.3887
Correa, S. W., Mello, C. R., Chou, S. C., Curi, N., & Norton, L. D. (2016). Soil erosion risk associated with climate change at Mantaro River basin, Peruvian Andes. CATENA, 147, 110–124. https://doi.org/10.1016/J.CATENA.2016.07.003
Drobinski, P., Silva, N. Da, Panthou, G., Bastin, S., Muller, C., Ahrens, B., Borga, M., Conte, D., Fosser, G., Giorgi, F., Güttler, I., Kotroni, V., Li, L., Morin, E., Önol, B., Quintana-Segui, P., Romera, R., & Torma, C. Z. (2018). Scaling precipitation extremes with temperature in the Mediterranean: past climate assessment and projection in anthropogenic scenarios. Climate Dynamics, 51(3), 1237–1257. https://doi.org/10.1007/s00382-016-3083-x
Eccel, E., & Tomozeiu, R. (2015). Increasing resolution of climate assessment and projection of temperature and precipitation in an alpine area. Theoretical and Applied Climatology, 120(3–4), 479–493. https://doi.org/10.1007/S00704-014-1181-4
Espinosa, L. A., Portela, M. M., & Rodrigues, R. (2019). Spatio-temporal variability of droughts over past 80 years in Madeira Island. Journal of Hydrology: Regional Studies, 25. https://doi.org/10.1016/j.ejrh.2019.100623
Gumus, V. (2023). Evaluating the effect of the SPI and SPEI methods on drought monitoring over Turkey. Journal of Hydrology, 626, 130386. https://doi.org/10.1016/J.JHYDROL.2023.130386
Gwet, K. L. (2008). Computing inter-rater reliability and its variance in the presence of high agreement. British Journal of Mathematical and Statistical Psychology, 61(1), 29–48. https://doi.org/10.1348/000711006X126600
Hayes, M., Svoboda, M., Wall, N., & Widhalm, M. (2011). The Lincoln Declaration on Drought Indices: Universal Meteorological Drought Index Recommended. Bulletin of the American Meteorological Society, 92(4), 485–488. https://doi.org/10.1175/2010BAMS3103.1
IPCC. (2023). AR6 Synthesis Report: Climate Change 2023. https://www.ipcc.ch/report/ar6/syr/
Laimighofer, J., & Laaha, G. (2022). How standard are standardized drought indices? Uncertainty components for the SPI & SPEI case. Journal of Hydrology, 613. https://doi.org/10.1016/j.jhydrol.2022.128385
Leng, G., Tang, Q., & Rayburg, S. (2015). Climate change impacts on meteorological, agricultural and hydrological droughts in China. Global and Planetary Change, 126, 23–34. https://doi.org/10.1016/j.gloplacha.2015.01.003
Lorenzo, M. N., Pereira, H., Alvarez, I., & Dias, J. M. (2024). Standardized Precipitation Index (SPI) evolution over the Iberian Peninsula during the 21st century. In Atmospheric Research (Vol. 297). Elsevier Ltd. https://doi.org/10.1016/j.atmosres.2023.107132
Lozano-Povis, A., Alvarez-Montalván, C. E., & Moggiano, N. (2021). Climate change in the Andes and its impact on agriculture: a systematic review. Scientia Agropecuaria, 12(1), 101–108. https://doi.org/10.17268/SCI.AGROPECU.2021.012
Marcos Valiente, Ó. (2001). Sequía: Definiciones, tipologías y métodos de cuantificación. In Investigaciones Geográficas, no (Vol. 26).
Meseguer-Ruiz, O., Serrano-Notivoli, R., Aránguiz-Acuña, A., Fuentealba, M., Nuñez-Hidalgo, I., Sarricolea, P., & Garreaud, R. (2024). Comparing SPI and SPEI to detect different precipitation and temperature regimes in Chile throughout the last four decades. Atmospheric Research, 297. https://doi.org/10.1016/j.atmosres.2023.107085
Mohammed, S., Alsafadi, K., Enaruvbe, G. O., Bashir, B., Elbeltagi, A., Széles, A., Alsalman, A., & Harsanyi, E. (2022). Assessing the impacts of agricultural drought (SPI/SPEI) on maize and wheat yields across Hungary. Scientific Reports, 12(1). https://doi.org/10.1038/s41598-022-12799-w
Mousavi, R., Johnson, D., Kroebel, R., & Byrne, J. (2023). Analysis of historical drought conditions based on SPI and SPEI at various timescales in the South Saskatchewan River Watershed, Alberta, Canada. Theoretical and Applied Climatology, 153(1–2), 873–887. https://doi.org/10.1007/s00704-023-04495-0
Mupepi, O., & Matsa, M. M. (2023). A combination of vegetation condition index, standardized precipitation index and human observation in monitoring spatio-temporal dynamics of drought. A case of Zvishavane District in Zimbabwe. Environmental Development, 45, 100802. https://doi.org/10.1016/J.ENVDEV.2023.100802
Nam, W.-H., Hayes, M. J., Wilhite, D. A., & Svoboda, M. D. (2015). Projection of Temporal Trends on Drought Characteristics using the Standardized Precipitation Evapotranspiration Index (SPEI) in South Korea. Journal of The Korean Society of Agricultural Engineers, 57(1), 37–45. https://doi.org/10.5389/ksae.2015.57.1.037
NCAR. (2024). Standardized Precipitation Index (SPI) | Climate Data Guide. https://climatedataguide.ucar.edu/climate-data/standardized-precipitation-index-spi
Nwayor, I. J., & Robeson, S. M. (2024). Exploring the relationship between SPI and SPEI in a warming world. Theoretical and Applied Climatology, 155(4), 2559–2569. https://doi.org/10.1007/s00704-023-04764-y
SENAMHI. (2020). Mapa Climático del Perú. https://www.senamhi.gob.pe/?p=mapa-climatico-del-peru
Sharma, A., & Goyal, M. K. (2020). Assessment of the changes in precipitation and temperature in Teesta River basin in Indian Himalayan Region under climate change. Atmospheric Research, 231, 104670. https://doi.org/10.1016/J.ATMOSRES.2019.104670
Singh, S., Kumar, A., & Kumara, S. (2023). Assessment of Drought in Meteorological Data Using SPI and SPEI Indicators for Sustaining Agricultural Productivity in the Agra Division of Uttar Pradesh, India. 285–303. https://doi.org/10.1007/978-3-031-36825-7_19
Tefera, A. S., Ayoade, J. O., & Bello, N. J. (2019). Comparative analyses of SPI and SPEI as drought assessment tools in Tigray Region, Northern Ethiopia. SN Applied Sciences, 1(10). https://doi.org/10.1007/s42452-019-1326-2
Tirivarombo, S., Osupile, D., & Eliasson, P. (2018). Drought monitoring and analysis: Standardised Precipitation Evapotranspiration Index (SPEI) and Standardised Precipitation Index (SPI). Physics and Chemistry of the Earth, Parts A/B/C, 106, 1–10. https://doi.org/10.1016/J.PCE.2018.07.001
Vergni, L., & Todisco, F. (2011). Spatio-temporal variability of precipitation, temperature and agricultural drought indices in Central Italy. Agricultural and Forest Meteorology, 151(3), 301–313. https://doi.org/10.1016/j.agrformet.2010.11.005
Vicente-Serrano, S. M., Beguería, S., & López-Moreno, J. I. (2010). A multiscalar drought index sensitive to global warming: The standardized precipitation evapotranspiration index. Journal of Climate, 23(7), 1696–1718. https://doi.org/10.1175/2009JCLI2909.1
Vorobevskii, I., Kronenberg, R., & Bernhofer, C. (2022). Linking different drought types in a small catchment from a statistical perspective – Case study of the Wernersbach catchment, Germany. Journal of Hydrology X, 15, 100122. https://doi.org/10.1016/j.hydroa.2022.100122
Wagesho, N., & Claire, M. (2016). Analysis of Rainfall Intensity-Duration-Frequency Relationship for Rwanda. Journal of Water Resource and Protection, 08(07), 706–723. https://doi.org/10.4236/JWARP.2016.87058
Wang, Y., Zhou, B., Qin, D., Wu, J., Gao, R., & Song, L. (2017). Changes in mean and extreme temperature and precipitation over the arid region of northwestern China: Observation and projection. Advances in Atmospheric Sciences, 34(3), 289–305. https://doi.org/10.1007/S00376-016-6160-5
WMO.
(2016). Handbook of Drought Indicators and Indices.
World Meteorological Organization (WMO), Geneva. 52 p.
Yang, C., Tuo, Y., Ma, J., & Zhang, D. (2019). Spatial and Temporal Evolution Characteristics of Drought in Yunnan Province from 1969 to 2018 Based on SPI/SPEI. Water, Air, and Soil Pollution, 230(11). https://doi.org/10.1007/s11270-019-4287-6
Yu, H., Wang, L., Zhang, J., & Chen, Y. (2023). A global drought-aridity index: The spatiotemporal standardized precipitation evapotranspiration index. Ecological Indicators, 153. https://doi.org/10.1016/j.ecolind.2023.110484
Zhu, Z., Duan, W., Zou, S., Zeng, Z., Chen, Y., Feng, M., Qin, J., & Liu, Y. (2024). Spatiotemporal characteristics of meteorological drought events in 34 major global river basins during 1901–2021. Science of The Total Environment, 921, 170913. https://doi.org/10.1016/J.SCITOTENV.2024.170913
Zubieta, R., Saavedra, M., Silva, Y., & Giráldez, L. (2017). Spatial analysis and temporal trends of daily precipitation concentration in the Mantaro river basin: Central Andes of Peru. Stochastic Environmental Research and Risk Assessment, 31(6), 1305–1318. https://doi.org/10.1007/S00477-016-1235-5