Sensibilidad al alcance en la valoración económica de la conservación de la biodiversidad en el Perú: el caso del Parque Nacional del Manu


Scope sensitivity in economic valuation of biodiversity conservation in Peru: The case of Manu National Park


Carlos Minaya¹; Carlos Orihuela¹; Felipe Vásquez²; José Dávila¹; Duber Chinguel¹


1   Universidad Nacional Agraria La Molina, Av. La Molina s/n, Lima, Perú.

2 Universidad del Desarrollo, Concepción, Chile.


* Autor corresponsal: cminaya@lamolina.edu.pe (C. Minaya).


ORCID de los autores:


C. Minaya: https://orcid.org/0000-0003-1691-6585

C. Orihuela: https://orcid.org/0000-0002-5787-0950  

F. Vásquez: https://orcid.org/0000-0002-0767-998X

J. Dávila: https://orcid.org/0000-0002-1310-1690  

D. Chinguel: https://orcid.org/0000-0002-4449-2348


RESUMEN


Diseñar políticas de conservación de la biodiversidad requiere no solo estimar los beneficios sociales, sino también confirmar que los resultados sean sensibles al alcance, una condición metodológica necesaria para su validez. Esto significa que la disposición a pagar (DAP) debe aumentar de forma monotónica conforme aumenta el tamaño o la cantidad del bien. Este estudio evalúa dicho efecto en la valoración económica de la conservación de la biodiversidad en el Parque Nacional del Manu, Perú, considerando atributos específicos. Se realizaron en total 2240 experimentos de elección con jefes de hogar en Lima mediante encuestas presenciales, y se aplicaron modelos logit para estimar la DAP marginal. Los resultados muestran que los atributos más valorados son la reducción de especies de flora en peligro de extinción (5,08 soles/mes) y la reducción de la deforestación (4,69 soles/mes); sin embargo, ningún atributo mostró sensibilidad al alcance. El análisis de clases latentes identificó dos grupos de preferencias heterogéneas respecto a la conservación de la biodiversidad en esta área protegida. El grupo “pro-conservación” (78,3%) asignó valores positivos y significativos a todos los atributos, excepto a la reducción, de 24 a 8 especies de fauna en peligro de extinción. Esta falta de sensibilidad al alcance podría deberse a la condición del Perú como país megadiverso, donde el valor intrínseco de no uso de la biodiversidad por sí solo podría justificar políticas de conservación in situ que implican costos modestos para un número relativamente pequeño de especies o hábitats carismáticos específicos.


Palabras clave: flora y fauna; disposición a pagar; funcionalidad del ecosistema; biodiversidad; sensibilidad al alcance.


ABSTRACT


Designing biodiversity conservation policies requires not only estimating social benefits but also confirming that results exhibit sensitivity to scope — a necessary methodological condition for validity. This means that willingness to pay (WTP) should increase monotonically with the size or quantity of the goods. This study evaluates that effect in the economic valuation of biodiversity conservation in Manu National Park, Peru, based on specific attributes. A total of 2,240 choice experiments were conducted with household heads in Lima through face-to-face surveys, and logit models were applied to estimate marginal WTP. Results show that the most valued attributes are reducing endangered plant species (PEN 5.08/month) and reducing deforestation (PEN 4.69/month); however, no attribute showed sensitivity to range. Latent class analysis identified two heterogeneous preference groups regarding biodiversity conservation in this protected area. The “pro-conservation” group (78.3%) assigned positive and significant values to all attributes except the reduction from 24 to 8 endangered fauna species. This lack of scope sensitivity may stem from Peru’s status as a megadiverse country, where the inherent non-use value of biodiversity alone could justify in situ conservation policies involving modest costs for relatively few species or specific charismatic habitats.


Keywords: flora and fauna; willingness to pay; ecosystem functionality; biodiversity; scope sensitivity.


Recibido: 15-09-2025.

Aceptado: 17-11-2025.                                                      

  
Esta obra está publicada bajo la licencia CC BY 4.0


INTRODUCTION


Because biodiversity plays a crucial role in societal development, its conservation should concern all humanity. However, global biodiversity faces a critical decline (Yuan, 2024): nearly one million plant and animal species risk extinction, mainly due to human activities. The current extinction rate is about 10 times higher than the average over the past ten million years (Yue, 2023; Spash, 2022).

The economic importance of biodiversity lies in the support it provides to ecosystems that deliver goods and services to productive sectors such as agriculture, forestry, fisheries, and tourism (Ascioti & Moraci, 2024; Kassahun et al., 2021; Welling et al., 2023). Mogollón et al. (2023) further highlight its role in medicine, the pharmaceutical industry, and food trade.

Biodiversity is also a vital input for ecosystem services; therefore, its economic value can be derived from these services. Nonetheless, many studies have valued biodiversity conservation as an independent good—a source of non-use value—typically estimated through stated preference methods such as contingent valuation and choice experiments (King et al., 2025; Strange, 2024).

Economic valuation expresses in monetary terms the changes in human well-being resulting from biodiversity loss or conservation, typically through estimating willingness to pay (WTP) for conservation (Lavado et al., 2021; Mercado et al., 2020). This measure is valuable as it provides a benchmark against which society can compare alternative development paths (Orihuela et al., 2020).

One of the main challenges in measuring the economic importance of biodiversity lies in the abstract and complex nature of its definition (Austen, 2021). This complexity makes it difficult to represent biodiversity, particularly in stated preference studies. Dávila et al. (2023) noted that society’s limited understanding of biodiversity issues hinders effective participation in valuation and management programs. According to Ratzke (2023) and Austen (2021), the intricate relationships within ecosystems remain difficult for the public to grasp, especially when using stated preference valuation techniques. Czajkowski et al. (2009) further observed that there are no simple ways to communicate biodiversity concepts or changes to the public, nor a standard framework for its valuation. While the number of species is a useful starting point, it should be complemented with attributes such as natural processes and specific habitats within ecosystems.

Choice experiments have aimed to reveal how a population evaluates preferences and trade-offs for a particular good or service (Block et al., 2024; Notaro & Grilli, 2023). Therefore, respondents must clearly understand what is being valued. This method accommodates a wide range of policy options, allowing respondents to assess trade-offs among attributes (Jumamyradov et al., 2023; Feilhauer et al., 2022).

In microeconomic theory, individuals are assumed to prefer more of a good to less (Lopes & Kipperberg, 2020). Hence, respondents are expected to pay more to avoid greater harm or to obtain higher quality or quantity of goods (Whitehead, 2016). This expectation, derived from the non-satiation axiom, is known in stated preference studies as scope sensitivity—a desirable property and a necessary condition for the validity of economic valuation (Maier et al., 2023; Dugstad et al., 2021).

Dávila et al. (2023) highlighted that scope sensitivity and the embedding effect are often confused, as both represent key conditions influencing distortions in WTP. The embedding effect has attracted growing attention for its potential bias in environmental valuations using stated preference methods (Beaudet et al., 2022).

The embedding effect (Kahneman & Knetsch, 1992) occurs when a public good receives a lower WTP when valued as part of a package rather than independently. This suggests that respondents may pay for moral satisfaction rather than reflect true preferences. When respondents exhibit strong altruism (the “warm glow” effect), variations in the good’s scope tend to have little impact on WTP.

By contrast, scope sensitivity refers to the condition in which individuals are willing to pay more for higher quality or quantity of a public good (Dávila et al., 2023; Dugstad et al., 2021). Maier et al. (2023) note that although no universal benchmark defines when scope sensitivity effects are economically significant, evaluating their magnitude and plausibility remains essential for testing the validity of stated preference studies.

Czajkowski et al. (2009) noted that economists face two main challenges when valuing changes in biodiversity: the wide range of quantifiable indicators and the lack of consensus on which are most relevant. Biodiversity can be described by the number of species or ecosystems, their spatial distribution, or their functional traits (Hooper et al., 2005). However, many of the most accurate ecological indicators may not be easily understood by the public, often leading to scope insensitivity in valuation studies.

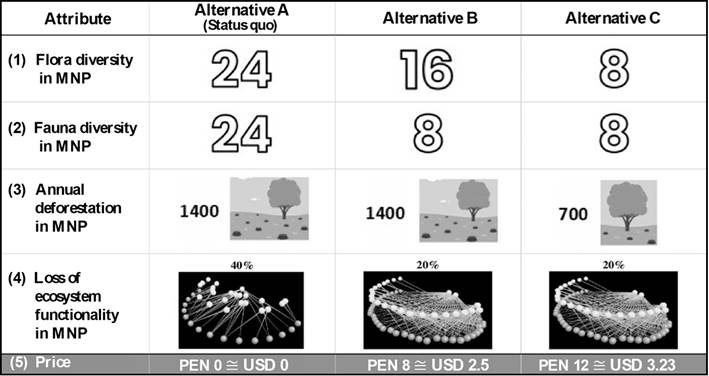
Given these challenges, this paper aims to evaluate scope sensitivity in the economic valuation of biodiversity conservation in Manu National Park (MNP) using selected attributes as proxy indicators, thereby contributing to the formulation of environmental policies. The null hypothesis assumes that society expresses a positive and significant marginal WTP for most biodiversity attributes but remains indifferent to conserving larger or smaller quantities of a specific attribute.


METHODOLOGY


Study area

MNP covers an area of 19,098 km² in southeastern Peru, spanning the departments of Cuzco and Madre de Dios (Figure 1). According to Orihuela et al. (2020), it is the most biologically diverse Natural Protected Area (NPA) in Peru, containing most of the flora and fauna species of the Peruvian Amazon. It also hosts at least 50 globally threatened animal species, according to the Red List of the International Union for Conservation of Nature (IUCN, 2024).

Dávila et al. (2023) further reported that MNP harbors 42.4% of Peru’s mammal species and 10% of the world’s bird species. Its tropical forests remain among the least disturbed by human activity, enabling the presence of isolated Indige-nous communities and a remarkable diversity of Amazonian ethnic groups.


Design of the choice experiments

The design of the choice experiments involved defining the key attributes of the good or service to be valued and specifying their respective levels. This approach enables observation of participants’ responses to alternative scenarios (Brock et al., 2025; Hernandez et al., 2024).

Following Orihuela et al. (2020), surveys on choice experiments in Peru showed that biodiversity is a complex concept with multiple attributes. Peruvian respondents most often associate biodiversity in NPAs with the variety of flora and fauna species and the extent of deforestation (in hectares) over time. Dávila et al. (2023) adopted these same attributes and add ecosystem functionality as a fifth conservation attribute.

Ecosystem functionality serves as an alternative representation of biodiversity, extending beyond individual species or geographic areas to encompass the interactions that sustain ecosystem stability and resilience. It can more effectively represent changes in human well-being (Lavado et al., 2021; Bartkowski et al., 2017), though respondents may be less familiar with this concept (Dávila et al., 2023; Jordano, 2016). Bartkowski et al. (2017) emphasized that numerous studies have sought to elicit the economic value people assign to biodiversity by focusing on its role in supporting ecosystem functions and processes. This reflects biodiversity’s contribution to enhancing ecological stability and resilience.

Accordingly, this study established a baseline scenario with four biodiversity attributes in MNP: 24 endangered flora species, 24 endangered fauna species, an average annual deforestation rate of 1400 ha/year, and a 40% loss of ecosystem functionality (i.e., the ecosystem currently functions at only 60%). Based on these values, a set of hypothetical scenarios was constructed to represent possible reductions in environmental impacts in the MNP.


Figura 1. Location of the Manu National Park.

Table 1

Attributes and levels of biodiversity in the design of the choice experiments


Attribute

Detail

Type of attribute

Proposed levels

1

Flora diversity in the MNP

Number of endangered plant species in MNP

Qualitative

Low (8)

Medium (16)

High (24) (Statu Quo)

2

Faunal diversity in the MNP

Number of endangered animal species in the MNP

Qualitative

Low (8)

Medium (16)

High (24) (Statu Quo)

3

Annual deforestation in the MNP

Size of annual deforestation in MNP

Qualitative

Low (300)

Medium (700)

Alto (1400) (Statu Quo)

4

Loss of functionality of ecosystems in the MNP

Loss of the interrelationship of flora and fauna species, ecosystems and habitats in the MNP.

Qualitative

Low (0%)

Average (20%)

High (40%) (Status Quo)

5

Price

Monthly financial contribution to reduce the loss of biodiversity in the MNP

Quantitative

PEN 0 (Statu Quo)

PEN 4

PEN 8

PEN 12

PEN 15

PEN 20


Table 1 shows that biodiversity attributes in the MNP can be improved, representing scenarios that mitigate biodiversity loss in this protected area. Although some hypothetical cases may be debatable from a scientific or ecological perspective, achieving measurable changes in biodiversity remains a valuable goal. Orihuela et al. (2020) emphasized that economic valuation studies of biodiversity conservation based on choice experiments are useful because they reveal preferences for conservation options directly linked to human welfare.

For economic valuation through choice experi-ments, inclusion of a price attribute is essential (Block et al., 2024; Notaro & Grilli, 2023; Omori et al., 2022). Accordingly, this study proposes a monthly monetary contribution, over a one-year period, to finance specific actions aimed at reducing environmental impacts that cause biodiversity loss in the MNP. The status quo for the flora and fauna diversity corresponds to 24 endangered plant and animal species in the MNP. For annual deforestation, it represents the average annual deforestation observed in this protected area, while the ecosystem functionality attribute follows Dávila et al. (2023). Figure 2 illustrates one of the experiment formats presented to respondents, developed using an efficient choice experiment design.

The efficient design in choice experiments derives from factorial design principles, which reduce the total number of attribute combinations through randomization and statistical optimization. In this study, five attributes were used—four with three levels each and one (price) with six levels—yielding a full factorial design of (34) × (6) = 486 possible combinations. Following Brock et al. (2025), the most applied design in the literature is the D-efficient design, which minimizes the inverse of the determinant of the variance–covariance matrix of a logit model. Using this approach, the study implemented 48 experiments in total, grouped into 12 formats containing four experiments each.


Figura 2. Example of a scenario to be presented to survey respondents.


In Figure 2, alternative A represents the status quo (baseline scenario), depicting the most adverse condition of biodiversity loss in the MNP. Alternative B presents a less severe loss but requires a monetary contribution. Alternative C offers another conservation scenario with lower biodiversity loss across most attributes, apart from ecosystem functionality; but it involves a higher payment. In summary, Figure 2 illustrates the structure of these alternatives as defined by the efficient design of the choice experiments.


RESULTS AND DISCUSSION


Descriptive results

The target population included all households in urban districts of Lima, Peru’s capital. The head of households served as the unit of analysis, as they are typically responsible for household expendi-ture. Sampling was probabilistic, with proportional allocation to district population sizes. The following table shows the sample size and distribution by district, the number of surveys by experimental format, and the main descriptive statistics derived from the survey data.

Among respondents, 85.7% selected a biodiversity conservation plan, indicating a nonzero WTP, while 14.3% preferred the status quo. Of the latter, 22.5% represented protest responses, believing that biodiversity conservation should be financed by the state or other entities.

In addition, 71.79% (402 individuals) reported traveling outside Lima during the past five years to enjoy nature. Of these, 75.12% recognized problems related to biodiversity loss and general environmental pollution, and 52.24% had paid an entrance fee to visit a natural area.

Overall, 79.11% of respondents were aware of endangered animal species in Peru, while 61.25% recognized endangered plant species. Both questions were dichotomous (yes/no), but follow-up questions asked respondents to identify up to three specific species and the main cause of their endangerment. Only 32.4% could do so for plants, compared with 62.23% for animals, suggesting that the public associates biodiversity conservation more strongly with fauna than flora.

From Table 2, 45.18% of respondents were female, with an average age of 42 years. Regarding marital status, 35.36% were single and 56.79% married.  In terms of income, 14.11% earned more than USD 1,337, whereas 10.36% earned the minimum wage (USD 274). Regarding education, 47.32% had higher education, including technical or university studies. Technical graduates accounted for 17.5%, university professionals 22.68%, and those with a master’s degree only 0.89% of the sample.


Economic valuation from conditional logit and mixed logit models

The main difference between conditional and mixed logit models is that the former assumes homogeneous preferences, no variation among individuals in their tastes or unobservable characteristics, while the latter allows for intrinsic or unobserved heterogeneity, meaning that individuals may differ in preferences even after controlling observed variables (Hernandez et al., 2024). Based on this distinction, both models were estimated. Each included two cases: one where biodiversity conservation attributes in the MNP served as the sole explanatory variables of WTP, and another where socioeconomic variables were added. For both models, WTP estimates for biodiversity attributes were more robust when socioeconomic variables were included. Age and income significantly explained WTP at the 5% confidence level. In the mixed logit model, marital status also showed a marginally significant relationship at the 6% level.


Table 2

Main descriptive statistics derived from the applied survey


Formats

Number of surveys per format

District

Total surveys

Variable

Obs

Mean

Std. dev.

Min

Max

1

30

Lima Centro

102

Antecedent of nature consumption

560

0.718

0.450

0

1

2

29

San Juan de Lurigancho

112

Identification of biodiversity problems

413

0.731

0.444

0

1

3

47

Los Olivos

44

Payment per ticket

401

0.524

0.500

0

1

4

59

San Martín de Porres

69

Identification of endangered plant species

554

0.619

0.486

0

1

5

62

Comas

61

Identification of endangered animal species

558

0.794

0.405

0

1

6

45

La Molina

15

Sex

557

0.454

0.498

0

1

7

52

San Borja

19

Marital status

552

0.732

0.655

0

3

8

56

Ate Vitarte

64

Age

560

41.913

18.019

19

70

9

53

Villa El Salvador

44

Education

506

5.597

1.898

1

10

10

52

Chorrillos

30

Income range

543

4.753

2.525

1

11

11

28

12

47


Total

560


560


Marginal WTP values represent positive changes relative to the status quo. For instance, as shown in Table 3, the WTP for Flora_16 indicates that, on average, respondents are willing to pay USD 1.08 per month for one year to reduce the number of endangered plant species in the MNP from 24 to 16 under the conditional logit model.


Table 3

Estimation of marginal WTP as a function of biodiversity conservation attributes and socio – economic variables


Conditional logit

Mixed logit

Attributes

WTP

P > z

WTP

P > z

Flora_16

4.041194

0

5.077422

0

Flora_8

4.493185

0

4.939714

0

Fauna_16

3.121112

0.001

2.167731

0.002

Fauna_8

2.102219

0.035

1.349355

0.13

Fx_Med

1.616367

0.112

3.128359

0.001

Fx_Null

2.239249

0.015

3.811837

0

Def_700

4.693332

0

4.7213

0

Def_300

3.147244

0.001

3.720751

0

Note: The original monetary values, presented in this Table, were estimated in soles (PEN). In this paper, the average annual exchange rate for 2024 was used (https://estadisticas.bcrp.gob.pe/estadisticas/series/mensuales/tipo-de-cambio-promedio-del-periodo)


The interpretation is consistent across all attributes, including those with the lowest levels, which represent the most favorable outcomes for biodiversity conservation. As shown in Table 3, the WTP associated with Flora_8 (USD 1.32 per month) indicates that, on average, respondents increase their contribution when preferring a scenario with only eight endangered plant species instead of twenty-four under the mixed logit model.


Scope sensitivity

To test scope sensitivity, the study compared whether WTP values for different attribute levels of biodiversity conservation were statistically dis-tinct. The following hypotheses were evaluated:

H0: DAP (Statu Quo-level 1)-DAP (Statu Quo-level 2) =0… (1)

H1: DAP (Statu Quo-level 1)-DAP (Statu Quo-level 2) ≠0… (2)

Rejecting the null hypothesis would indicate that respondents’ preferences across biodiversity levels differ, showing sensitivity to scope (Dávila et al., 2023).

According to Table 4, scope sensitivity was not observed because all estimated coefficients (WTP differentials) were statistically insignificant in both models—whether biodiversity attributes alone or combined with socioeconomic variables.

Unlike Table 3, these coefficients capture changes in WTP between two levels other than the status quo. Only the fauna attribute reached marginal significance (9%), but with an unexpected sign.

For this attribute, the result implies that respondents were willing to pay USD 1.59 less per month over one year to reduce endangered fauna in the MNP from 16 to 8 species, contradicting economic theory and logical expectation.


Latent class analysis

Latent Class Analysis (LCA) is a statistical method that classifies individuals into exhaustive and mutually exclusive groups based on internal characteristics such as attitudes, perceptions, and preferences—essentially any subjective factor (Zeng et al., 2025; Omori et al., 2024; Mu et al., 2023).

Johnson et al. (2022), Beaudet et al. (2022), and Saengavut and Somswasdi (2022) noted that LCA offers advantages over traditional segmentation methods such as factor or cluster analysis. Similarly, Weller et al. (2020) described LCA as an exploratory tool that also supports confirmatory research by identifying the optimal population distribution, segment size, and behavioral patterns within each class.

Given that respondent preferences are not homogeneous, the total population can be divided into distinct groups. Using Stata 18 software and the variables sex, marital status, age, education, and income, two exhaustive and exclusive classes were identified through the expectation–maximization algorithm.

Although model fit and parsimony criteria such as the Bayesian Information Criterion and Akaike information criterion typically guide class selection, in this study, models with three or more classes failed to converge.

Table 5 presents the marginal WTP values by class, estimated using the conditional logit model, which accounts for preference heterogeneity. Segment 1, representing 78.3% of respondents, can be described as pro–biodiversity conservation, whereas Class 2 (21.7%) is indifferent to the status quo.


Table 4

Scope sensitivity estimation


Conditional logit

Mixed logit

Changes in attribute levels

WTP differential

P > z

WTP differential

P > z

Flora_16 – Flora_8

0.8694387

0.306

1.274333

0.207

Fauna_16 – Fauna_8

-1.59089

0.083

-1.669227

0.133

Fx_Med – Fx_Null

0.3674571

0.675

-0.3081261

0.795

Def_700 – Def_300

-0.4113083

0.646

-1.712394

0.124

Scope sensitivity including socioeconomic variables


Flora_16 – Flora_8

0.451991

0.61

-0.1377079

0.858

Fauna_16 – Fauna_8

-1.018893

0.278

-0.8183762

0.33

Fx_ Med – Fx_Null

0.6228819

0.504

0.6834776

0.423

Def_700 – Def_300

-1.546088

0.103

-1.000549

0.221

Note: The original monetary values, presented in this Table, were estimated in soles (PEN). In this paper, the average annual exchange rate for 2024 was used (https://estadisticas.bcrp.gob.pe/estadisticas/series/mensuales/tipo-de-cambio-promedio-del-periodo).

Table 5

Marginals WTP, according to class determined


Attribute

WTP

Std. dev.

z

P > z

[95% conf.

interval]

C1_sq

-25.74819

2.742543

-9.39

0

-31.12347

-20.3729

C1_Flora_16

5.024898

0.9734397

5.16

0

3.116992

6.932805

C1_Flora_8

5.432013

0.9490719

5.72

0

3.571866

7.29216

C1_Fauna_16

2.712222

0.8329431

3.26

0.001

1.079683

4.34476

C1_Fauna_8

1.027912

0.9597698

1.07

0.284

-0.8532021

2.909026

C1_Fx_Med

4.260992

1.002769

4.25

0

2.2956

6.226383

C1_Fx_Null

4.301998

0.8721047

4.93

0

2.592704

6.011291

C1_Def_700

5.358192

0.9553826

5.61

0

3.485676

7.230707

C1_Def_300

4.661212

0.9805781

4.75

0

2.739315

6.58311

C2_sq

2.268718

3.595822

0.63

0.528

-4.778964

9.3164

C2_Flora_16

5.599753

3.035405

1.84

0.065

-0.3495318

11.54904

C2_Flora_8

4.927048

3.042198

1.62

0.105

-1.03555

10.88965

C2_Fauna_16

0.9392991

1.756048

0.53

0.593

-2.502491

4.38109

C2_Fauna_8

-0.3761382

1.739591

-0.22

0.829

-3.785674

3.033398

C2_Fx_Med

-2.428073

1.701922

-1.43

0.154

-5.763778

0.9076328

C2_Fx_Null

-1.143739

1.499661

-0.76

0.446

-4.083021

1.795542

C2_Def_700

-2.14402

1.72973

-1.24

0.215

-5.534227

1.246188

C2_Def_300

-4.784547

2.511697

-1.9

0.057

-9.707383

0.138289

Note: The original monetary values, presented in this table, were estimated in soles (PEN). In this paper, the average annual exchange rate for 2024 was used (https://estadisticas.bcrp.gob.pe/estadisticas/series/mensuales/tipo-de-cambio-promedio-del-periodo).


Class 1 shows positive coefficients and expected WTP magnitudes across all attributes. In contrast, Class 2 displays a positive coefficient for the status quo (sq), which is unexpected, and several attributes with negative WTP values, indicating behavior inconsistent with economic rationality. Notably, in Class 1, only the Fauna_8 attribute is insignificant at the 5% level.

Nobel et al. (2020), based on a meta-analysis, argued that the economic valuation of biodiversity conservation generally shows limited sensitivity to biodiversity indicators such as habitat type or taxonomic group. They emphasized that management policies for protected areas, when informed by economic studies, must clearly define biodiversity attributes.

Similarly, Bartkowski et al. (2017) noted that representing species and habitats quantitatively can help respondents better understand biodiversity; however, focusing on a single component may oversimplify it, while overly broad representations may obscure distinctions between assets, both of which can cause scope insensitivity.

Morse-Jones et al. (2014) and Ojea and Loureiro (2009) further observed that using non-charismatic species or little-known habitats can make respondents perceive varying biodiversity levels as similar, again leading to scope insensitivity. Consequently, poorly framed or inadequately presented hypothetical markets for biodiversity conservation can yield zero or even negative marginal utility, distorting decision-making results (Lavado et al., 2021; Mwebaze et al., 2018).

In Peru, Dávila et al. (2023) and Orihuela et al. (2020) valued biodiversity conservation attributes in NPAs using choice experiments based on non–face-to-face and face-to-face surveys, respectively. Their findings show marginal WTP values for flora and fauna conservation of USD 1.05 and USD 0.98 per month in the first study, and USD 0.58 and USD 1.35 per month in the second. Dugstad et al. (2021) note that testing scope sensitivity in choice experiment studies is rare as a validity check. They further argue that many assume unitary range elasticity. In their applied study on renewable energy expansion, elasticity values ranged between 0.13 and 0.58, depending on the attribute, model specification, geographic subsample, and measurement units. The authors conclude that no universally accepted benchmark exists to determine whether scope effects are economically significant.

In contingent valuation studies, Hoehn and Randall (1987) and Hoehn & Loomis (1993) identified additivity problems, where the total value is substantially less than the sum of independently valued parts. Foster & Mourato (2003) argued that this issue should not arise in choice experiments, since presenting both the whole and its parts ensures internal consistency. They emphasized that it is crucial to determine whether respondents allocate total value across components or sum the individual parts to value the whole. Overall, the choice experiment method tends to exhibit greater scope sensitivity than contingent valuation.

In this paper, although nearly all attribute levels were significant, apart from Fx_Med in the conditional logit model and Fauna_8 in the mixed logit model, changes between levels show no evidence of scope sensitivity in either model (Table 4). Czajkowski and Hanley (2009) suggested that this may occur because combining multiple experimental attributes can confuse respondents, introducing methodological limitations in valuation studies.

These results differ from Dávila et al. (2023), who found scope sensitivity for fauna and deforestation attributes, with marginal WTP values of USD 1.67 and USD 1.17 per month, respectively. However, the deforestation attribute showed an unexpected sign: WTP was–USD 0.91 per month for the transition from status quo to intermediate deforestation, but USD 0.27 per month for status quo to lower deforestation. For ecosystem functionality, marginal WTP values were USD 2.78 and USD 3.12 per month, respectively.

This outcome may be explained by Peru’s status as a megadiverse country, where assessing economic value based on small changes in species numbers may be impractical. The country’s protected areas span millions of hectares and host hundreds or thousands of flora and fauna species. Consequently, the evaluated levels of threatened species—24, 16, and 8—may seem too minor to influence respondents’ WTP for biodiversity conservation (Lavado et al., 2021).

Regarding the LCA, Table 2 shows at least two distinct groups in terms of environmental behavior and awareness of biodiversity loss in Peru. Approximately 27% and 19% of respondents answered negatively to dichotomous questions on environmental consumption and biodiversity identification, respectively. These results align with the two categories defined in this study: pro–biodiversity conservation and indifferent to the status quo (Table 5).

This finding is consistent with Mao et al. (2021), who analyzed preference heterogeneity in valuing wetland ecosystem services in Sanjiang, China, and identified three segments: those prioritizing resource protection, those favoring landscape protection, and price-sensitive respondents. In their study, individuals with higher incomes and greater visitation frequency (positive consump-tion) tended to favor landscape protection.


CONCLUSIONS


The WTP was estimated for each attribute representing biodiversity conservation in MNP. The highest values corresponded to reducing endangered flora species from 24 to 16 and decreasing deforestation from 1,400 to 700 hectares.

However, scope sensitivity could not be confirmed under the mixed logit model. This may be due to Peru’s megadiverse nature, where the intrinsic non-use value of biodiversity alone may justify in situ conservation policies. For Peruvian respondents, contributing to biodiversity protection may suffice regardless of whether endangered fauna decline from 24 to 16 or from 24 to 8 species. Although only one comparable Peruvian study exists, it relied on non–face-to-face surveys, which are more prone to respondent bias as noted in the literature.

Future research should explore additional attributes that better represent biodiversity conservation in Peru’s protected areas and replicate such studies across other NPAs, considering the country’s megadiversity.

Finally, public policies promoting in situ biodiversity conservation or integrating conservation into tourism programs should ensure appropriate representation of both use and non-use values, as contextually relevant.


REFERENCIAS BIBLIOGRÁFICAS


Austen, G. E., Dallimer, M., Irvine, K. N., Maund, P. R., Fish, R. D., & Davies, Z. G. (2021). Exploring shared public perspectives on biodiversity attributes. People and Nature, 3(4), 901-913. https://doi.org/10.1002/pan3.10237

Ascioti, F.A., & Moraci, F. (2024). On the value of “God” and thus of nature: Ethicality, meaningfulness, and usefulness of monetary valuation of ecosystem services and natural capital. Environmental and Sustainability Indicators, 23. https://doi.org/10.1016/j.indic.2024.100458

Bartkowski, B. (2017). Economic valuation of biodiversity: An interdisciplinary conceptual perspective (1st ed.). Routledge. https://doi.org/10.4324/9781315175911

Beaudet, C., Tardieu, L., & David, M. (2022). Are citizens willing to accept changes in public lighting for biodiversity conservation? Ecological Economics, 200, 107527. https://doi.org/10.1016/j.ecolecon.2022.107527

Block, J. B., Danne, M., & Mußhoff, O. (2024). Farmers’ willingness to participate in a carbon sequestration program – A discrete choice experiment. Environmental Management, 74, 332–349. https://doi.org/10.1007/s00267-024-01963-9

Brock, M., Cromie, R. L., Newth, J. L., & Wood, K. A. (2025). Using choice experiments to understand public preferences for reducing lead-based ammunition for environmental and health improvements in wetlands ecosystems. Journal for Nature Conservation, 84, 126811. https://doi.org/10.1016/j.jnc.2024.126811

Czajkowski, M., Buszko-Briggs, M., & Hanley, N. (2009). Valuing changes in forest biodiversity. Ecological Economics, 68(12), 2910-2917. https://doi.org/10.1016/j.ecolecon.2009.06.016

Das, B. K. (2024). Beyond the ‘protected area’ paradigm in conservation: Exploring India’s forest legislation as a new conservation model for developing countries. Environmental Management, 74, 1223–1238. https://doi.org/10.1007/s00267-024-02056-3

Dávila, J., Vásquez-Lavín, F., Orihuela, C. E., Ponce Oliva, R. D., Lavado-Solis, K., Paredes-Vilca, O., Mogollón Ñañez, R. (2023). Evaluando las condiciones de racionalidad y plausibilidad en la valoración de conservar la biodiversidad de un país megabiodiverso. El caso del Manu en Perú. Economía Agraria y Recursos Naturales - Agricultural and Resource Economics, 23(1), 35–54. https://doi.org/10.7201/earn.2023.01.02

Dugstad, A., Grimsrud, K. M., Kipperberg, G., et al. (2021). Scope elasticity of willingness to pay in discrete choice experiments. Environmental and Resource Economics, 80, 21–57. https://doi.org/10.1007/s10640-021-00577-7

Feilhauer, E., Schnitzer, M., Walde, J., & Tappeiner, G. (2022). What residents of potential Olympic cities want: using conjoint analysis to deal with dominant and heterogeneous preferences. Current Issues in Tourism, 26(13), 2101–2114. https://doi.org/10.1080/13683500.2022.2067030

Foster, V., & Mourato, S. (2003). Elicitation format and sensitivity to scope. Environmental and Resource Economics, 24, 141–160. https://doi.org/10.1023/A:1022856329552

Hernandez, J. I., Mouter, N., & van Cranenburgh, S. (2024). An economically-consistent discrete choice model with flexible utility specification based on artificial neural networks. arXiv preprint arXiv:2404.13198. https://doi.org/10.48550/arXiv.2404.13198

Hooper, D. U., Chapin III, F. S., Ewel, J. J., Hector, A., Inchausti, P., Lavorel, S., ... & Wardle, D. A. (2005). Effects of biodiversity on ecosystem functioning: A consensus of current knowledge. Ecological Monographs, 75(1), 3-35. https://doi.org/10.1890/04-0922

Hoehn, J. P., & Randall, A. (1987). A satisfactory benefit-cost indicator from contingent valuation. Journal of Environmental Economics and Management, 14(3), 226-247. https://doi.org/10.1016/0095-0696(87)90018-0

Hoehn, J. P., & Loomis, J. B. (1993). Substitution effects in the valuation of multiple environmental programs. Journal of Environmental Economics and Management, 25(1), 56-75. https://doi.org/10.1006/jeem.1993.1026

Johnson, D., Browne, D. T., Meade, R. D., Prime, H., & Wade, M. (2022). Latent classes of adverse and benevolent childhood experiences in a multinational sample of parents and their relation to parent, child, and family functioning during the COVID-19 pandemic. International Journal of Environmental Research and Public Health, 19(20), 13581. https://doi.org/10.3390/ijerph192013581

Jordano, P. (2016). Chasing ecological interactions. PLoS Biology, 14(9), e1002559. https://doi.org/10.1371/journal.pbio.1002559

Jumamyradov, M., Craig, B. M., Munkin, M., & Greene, W. (2023). Comparing the conditional logit estimates and true parameters under preference heterogeneity: A simulated discrete choice experiment. Econometrics, 11(1), 4. https://doi.org/10.3390/econometrics11010004

Kahneman, D., & Knetsch, J. L. (1992). Valuing public goods: The purchase of moral satisfaction. Journal of Environmental Economics and Management, 22(1), 57-70. https://doi.org/10.1016/0095-0696(92)90019-S

Kassahun, H. T., Swait, J., & Jacobsen, J. B. (2021). Distortions in willingness-to-pay for public goods induced by endemic distrust in institutions. Journal of Choice Modelling, 39, 100271. https://doi.org/10.1016/j.jocm.2021.100271

King, P. M., Dallimer, M., Lundhede, T., Austen, G. E., Fisher, J. C., Irvine, K. N., ... & Davies, Z. G. (2025). Stated preferences for the colours, smells, and sounds of biodiversity. Ecological Economics, 227, 108410. https://doi.org/10.1016/j.ecolecon.2024.108410

Lantremange, H. (2024). Functionalism in ecology and economics: Epistemological affinities and temptations. Biological Conservation, 298, 110762. https://doi.org/10.1016/j.biocon.2024.110762

Lavado-Solís, K., Orihuela, C.E., Vásquez-Lavín, F., & Dávila, J. (2021). Economic valuation of biodiversity conservation: The case of Yanachaga-Chemillén National Park. Economía Agraria y Recursos Naturales, 21(2), 101-120. https://doi.org/10.7201/earn.2021.02.05

Lopes, A. F., & Kipperberg, G. (2020). Diagnosing insensitivity to scope in contingent valuation. Environmental and Resource Economics, 77, 191–216. https://doi.org/10.1007/s10640-020-00470-9

Maier, M., Caviola, L., Schubert, S., & Harris, A. J. (2023). Investigating (sequential) unit asking: An unsuccessful quest for scope sensitivity in willingness to donate judgments. Journal of Behavioral Decision Making, 36(4), e2335. https://doi.org/10.1002/bdm.2335

Mao, B., Li, S., Wu, K., Li, Y., & Zhang, Z. (2021). Valuation of ecosystem service functions and preference heterogeneity of the public in the Sanjiang Plain Wetlands based on a choice experiment. Ecologica Sinica, 40(4), 1045-1056. https://doi.org/10.5846/stxb201604120669

Mercado, W., Vásquez, F., Ubillus, K. & Orihuela, C. (2020). ¿Es relevante la biodiversidad en la decisión de visita a los parques nacionales en el Perú? Economía Agraria y Recursos Naturales, 20(2), 7-29. https://doi.org/10.7201/earn.2020.02.01

Mogollón, R., Orihuela, C., Díaz, S., & Dávila, J. (2023). Integrating biodiversity conservation into local decision-making: A study on willingness to pay in Yanachaga-Chemillén National Park. Revista Iberoamericana de Estudios Municipales, 27, 1-20.

Morse-Jones, S., Bateman, I. J., Kontoleon, A., Ferrini, S., Burgess, N. D., & Turner, R. K. (2014). Stated preferences for tropical wildlife conservation amongst distant beneficiaries: Charisma, endemism, scope and substitution effects. In Valuing Ecosystem Services (pp. 88-104). Edward Elgar Publishing. https://doi.org/10.4337/9781781955161.00016

Mu, L., Mou, M., Tang, H., & Gao, S. (2023). Exploring preference and willingness for rural water pollution control: A choice experiment approach incorporating extended theory of planned behaviour. Journal of Environmental Management, 332, 117408. https://doi.org/10.1016/j.jenvman.2023.117408

Mwebaze, P., Marris, G. C., Brown, M., MacLeod, A., Jones, G., & Budge, G. E. (2018). Measuring public perception and preferences for ecosystem services: A case study of pollination in the UK. Land Use Policy, 71, 355-362. https://doi.org/10.1016/j.landusepol.2017.11.045

Nobel, A., Lizin, S., Brouwer, R., Bruns, S. B., Stern, D. I., & Malina, R. (2020). Are biodiversity losses valued differently when they are caused by human activities? A meta-analysis of the non-use valuation literature. Environmental Research Letters, 15(7), 073003. https://doi.org/10.1088/1748-9326/ab8ec2

Notaro, S., & Grilli, G. (2023). The Influence of Ambient Weather Conditions on Stated Preferences for Ecosystem Services Management. Environmental Management, 72, 1228–1240. https://doi.org/10.1007/s00267-023-01839-4

Ojea, E., & Loureiro, M. L. (2009). Valuation of wildlife: Revising some additional considerations for scope tests. Contemporary Economic Policy, 27(2), 236-250. https://doi.org/10.1111/j.1465-7287.2008.00129.x

Omori, Y., Kuriyama, K., Tsuge, T., Onuma, A., & Shoji, Y. (2024). Coastal infrastructure typology and people's preference-based grey-green-hybrid infrastructure classifications using a latent class model: A case study of Japan. International Journal of Disaster Risk Reduction, 114, 104992. https://doi.org/10.1016/j.ijdrr.2024.104992

Omori, K., Kuriyama, T., Tsuge, A., Onuma, Y., & Shoji, Y. (2022). Coastal community preferences of gray, green, and hybrid infrastructure against tsunamis: a case study of Japan, in: In Green Infrastructure and Climate Change Adaptation: Function, Implementation and Governance, Springer Nature Singapore, Singapore, pp. 415–441, https://doi.org/10.1007/978-981-16-6791-6_25

Orihuela Romero, C. E., Minaya, C. A., Mercado, W., Jiménez, L. A., Estrada, M., & Gómez, H. J. (2020). Efecto distancia en la disposición a pagar por la conservación de la biodiversidad: El caso de un área protegida megadiversa. Economía Agraria y Recursos Naturales - Agricultural and Resource Economics, 20(1), 169-190. https://doi.org/10.7201/earn.2020.01.08

Ratzke, L. (2023). Revealing preferences for urban biodiversity as an environmental good. Ecological Economics, 212, 107884. https://doi.org/10.1016/j.ecolecon.2023.107884

Saengavut, V., & Somswasdi, C. (2022). Preference heterogeneity of local participation in coupling conservation and community-based entrepreneurship development. Sustainability, 14(12), 7441. https://doi.org/10.3390/su14127441

Spash, C. L. (2022). Conservation in conflict: Corporations, capitalism and sustainable development. Biological Conservation, 269, 109528. https://doi.org/10.1016/j.biocon.2022.109528

Strange, N., zu Ermgassen, S., Marshall, E., Bull, J. W., & Jacobsen, J. B. (2024). Why it matters how biodiversity is measured in environmental valuation studies compared to conservation science. Biological Conservation, 292, 110546. https://doi.org/10.1016/j.biocon.2024.110546

Welling, M., Dehnhardt, A., & Aß, S. M. (2023). Does validity matter for policymakers? Evidence from choice experiments on urban green. Journal of Environmental Economics and Policy, 12(4), 524–538. https://doi.org/10.1080/21606544.2023.2186954

Weller, B. E., Bowen, N. K., & Faubert, S. J. (2020). Latent class analysis: A guide to best practice. Journal of Black Psychology, 46(4), 287-311. https://doi.org/10.1177/0095798420930932

Whitehead, J. C. (2016). Plausible responsiveness to scope in contingent valuation. Ecological Economics, 128, 17-22. https://doi.org/10.1016/j.ecolecon.2016.03.011

Yuan, R., Zhang, N., & Zhang, Q. (2024). The impact of habitat loss and fragmentation on biodiversity in global protected areas. Science of The Total Environment, 931, 173004. https://doi.org/10.1016/j.scitotenv.2024.173004

Yue, Q., Zhang, J., Qin, R., Huang, J., & He, J. (2023). Analysis on the loss path and cooperative protection of global biodiversity based on input-output model. Journal of Cleaner Production, 419, 138232. https://doi.org/10.1016/j.jclepro.2023.138232

Zeng, Y., Mao, B., Tang, Y., & Ma, J. (2025). Public preferences for desertification control in the context of decision-rule heterogeneity: an integrated latent class and generalized random regret minimization approach. Journal of Environmental Planning and Management, 1–19. https://doi.org/10.1080/09640568.2025.2508756