 |
INTRODUCTION
Evaluation of juvenile bullfrog (Lithobates catesbeianus) growth by comparison and selection of growth models under commercial culture conditions
Evaluación del crecimiento de juveniles de rana toro (Lithobates catesbeianus) mediante la comparación y selección de modelos de crecimiento en condiciones comerciales de cultivo
Carlos Humberto Hernández-López1 *; Jesús Jurado-Molina2
1 TecNM / Instituto Tecnológico de Mazatlán, Corsario 1 No. 203, Sinaloa, México.
2 Consultor independiente, Ciudad de México, México.
* Autor corresponsal: carlos.hl@mazatlan.tecnm.mx (C. H. Hernández-López).
ORCID de los autores:
C. H. Hernández-López: https://orcid.org/0000-0002-6938-0502 J. Jurado-Molina: https://orcid.org/0000-0001-5611-0733
ABSTRACT
In aquaculture, knowledge growth patterns are essential for optimizing production. This study evaluated and comparated the predictive capacity of five weight growth models to determine which best describes the individual growth of Lithobates catesbeianus under two commercial stocking densities. The experiment was conducted in triplicate in six commercial plastic ponds for 52 days (October to December 2024), using 4500 juveniles with an initial weight of 1.7 ± 0.81 g. The models were fitted to estimate weight as a function of age, and the optimal model was selected using the Akaike Information Criterion (AIC). The Ruiz-Velazco model showed the lowest AIC and data support greater than 95% at both densities, being the most appropriate to describe the growth of juvenile bullfrogs under commercial conditions. These results constitute a reference for planning the grow-out phase, although caution is advised when extrapolating them to adult specimens. This study highlights the relevance of a multi-model approach to reduce bias associated with single model selection, improving the accuracy and reliability of bullfrog juvenile growth predictions under commercial farming conditions.
Keywords: Lithobates catesbeianus; aquaculture; density; growth models; Akaike Information Criterion.
RESUMEN
En la acuicultura, el conocimiento del crecimiento es fundamental para optimizar la producción. Este estudio evaluó y comparó la capacidad predictiva de cinco modelos de crecimiento en peso, para determinar el que mejor describe el crecimiento individual de Lithobates catesbeianus bajo dos densidades de cultivo comercial. El experimento se realizó por triplicado en seis estanques comerciales de plástico durante 52 días (octubre-diciembre de 2024) empleando 4500 juveniles con peso inicial de 1,7 ± 0,81 g. Los modelos fueron ajustados para estimar el peso en función de la edad, y el mejor se determinó mediante el Criterio de Información de Akaike. El modelo de Ruiz-Velazco presentó el menor AIC y un soporte en los datos superior al 95 % en ambas densidades, siendo el más adecuado para describir el crecimiento de juveniles de rana toro en condiciones comerciales. Estos resultados constituyen una referencia para la planificación de la etapa de engorda, aunque se recomienda cautela al extrapolarlos a ejemplares adultos. Este estudio destaca la importancia de un enfoque multimodelo para reducir el sesgo asociado a la selección única de modelos, mejorando la precisión y confiabilidad de las predicciones de crecimiento de juveniles de rana toro bajo condiciones comerciales de cultivo.
Palabras clave: Lithobates catesbeianus; acuacultura; densidad; modelos de crecimiento; Criterio de Información de Akaike.
Recibido: 20-02-2026.
Aceptado: 17-05-2026.
|
INTRODUCTION
Global aquaculture production of frogs increased from 111,000 tons in 2011 to 229,000 tons in 2022, accounting for 51% of total aquatic organism production in that year (FAO, 2024). The bullfrog, a species native to North America, has been cultured since the early 20th century in the United States and Canada (Zhang et al., 2025) and has emerged as a key species in aquaculture due to its high economic value (FAO, 2025), particularly for its hind legs, which are considered a gourmet product (Dodd & Jennings, 2021; Ruiz-Haddad et al., 2022).
Over the past decade, the culture of this species has expanded considerably, driven by its rapid growth rate, adaptability to farming conditions, and strong acceptance in high-value markets. In 2013, China produced approximately 150,000 tons (Zhang et al., 2015), and substantial production has also been reported in Taiwan, Brazil, Ecuador, Guatemala, and Mexico (FAO, 2022).
In Mexico, the production of bullfrog has shown sustained growth, reaching 228 tons in 2017, which represents approximately 1% of national aquaculture production (CONAPESCA, 2017). Despite its relatively low contribution in terms of total volume, frog farming is highly profitable on a per-unit-area basis and constitutes a viable strategy for diversifying small-scale aquaculture. The main producing states include State of México, Sinaloa, Nayarit, and Jalisco (Islas-Ojeda et al., 2021).
In aquaculture, growth is a key factor for profi-tability (Jurado-Molina et al., 2023). However, the implementation of models describing the growth of bullfrog remains limited, with current studies primarily based on absolute growth rate (AGR) and specific growth rate (SGR) (Fonseca-Madrigal et al., 2023). The development of modern aquaculture requires biomass optimization (Jurado-Molina et al., 2023) through the integration of bioeconomic analyses and production models that enable cost estimation and efficiency improvement (Hernández-Llamas & Ratkowsky, 2004).
In this context, determining growth limits and formulating a weight growth model for bullfrog are essential for designing sustainable and profitable strategies. This trend highlights the increasing importance of growth modeling in research and its application within the aquaculture sector.
Traditionally, the von Bertalanffy model has been the most widely used to describe the growth of aquatic organisms (Katsanevakis & Maravelias, 2008), followed by the Schnute and Richards (1990), Gompertz (1825), and logistic models (Ricker, 1975). However, their applicability may be limited for certain species under culture conditions (Castillo-Vargasmachuca et al., 2016; McGuigan et al., 2023), which has led to the exploration of alternative approaches such as the Schnute model (1981) and the model proposed by Ruiz-Velazco et al. (2010). The model proposed by Schnute (1981) encompasses, as special cases, the growth models of von Bertalanffy, Schnute and Richards, Gompertz, and logistic. In turn, the Ruiz-Velazco model is an adaptation of the growth curve described by Hernández-Llamas and Ratkowsky (2004), incorporating parameters related to initial and final weight over the culture period.
Growth analysis of a species is typically based on selecting and fitting a theoretical model to observed data (Katsanevakis & Maravelias, 2008). However, a more robust approach (Akaike, 1981) involves fitting multiple candidate models and applying information theory to identify the optimal model using the Akaike Information Criterion (AIC). This model selection procedure allows for determining which model most accurately describes the variation in weight of bullfrog under commercial culture conditions.
The objective of this study was to compare the predictive performance of the four cases of the Schnute model and the Ruiz-Velazco model to determine which best explains the observed weight growth data of bullfrog under two culture densities over a 52-day period.
METHODOLOGY
The study was conducted at a commercial bullfrog farm located in southern Mazatlán, Sinaloa, Mexico, as part of a study evaluating the effect of two stocking densities on the growth of juvenile bullfrogs reared under laboratory conditions and pre-fattened for 52 days prior to their final growth stage.
For the study, 4,500 juvenile bullfrogs (initial weight: 1.7 g ± 0.81 g; initial length: 2.54 cm ± 0.72 cm) were distributed into six 16.5 m² tanks at stocking densities of 500 frogs/m² (D500) and 1,000 frogs/m² (D1000), each with three replicates. The lower density was used as a reference for the producer’s conventional management practices, while the higher density aimed to double production per m².
The commercial tanks, made of plastic, were installed within a greenhouse-type structure with UV protection (white plastic, 800 gauge) and a drainage system consisting of 2-inch diameter PVC pipes. Daily cleaning was carried out in the mornings. Frogs were fed twice daily (08:00 h and 16:00 h) with an extruded diet (45% crude protein, 16% crude lipids, 2 mm pellet) produced by High Quality Food Pedregal Company. The daily ration corresponded to 5% of the estimated biomass and was adjusted after each sampling.
Biometric measurements were recorded every 7 days to evaluate survival, weight (g), and length (cm). Frog samples were collected weekly (mean of 112 frogs per tank) from each tank using dip nets. The first biometric measurement was conducted 10 days after stocking due to harvesting constraints. A total of 982 weight–age data points were obtained for D500 and 803 for D1000.
In particular, during the final month, a total of 130 frogs were sampled (80 for D500 and 50 for D1000). Mean survival was estimated through daily collection and counting of dead frogs from each tank. Due to the shallow depth of the flooded area, the tank bottom was easily visible, facilitating the identification and counting of dead frogs, which sometimes floated and at other times settled at the bottom.
Water quality was monitored daily in all tanks. Water temperature (°C) was measured daily using an oxygen meter (model YSI 85; YSI, Yellow Springs, OH, USA) (Hernández-López et al., 2016), pH was determined using a digital pH meter (HANNA Instruments, Mexico City, Mexico).
Five candidate models were fitted to the age and mean weight-at-age data: the Schnute model (1981) in its four general cases and the model proposed by Ruiz-Velazco et al. (2010). The four cases of the Schnute model (1981) are as follows:
 (1)
(1)
 (2)
(2)
 (3)
(3)
 (4)
(4)
Where W(t) is the individual weight at age t; W1 and W2 represent the initial and final weights, respectively. Parameter a describes growth in units of time (years), whereas parameter b is associated with the inflection point of the growth curve.
The Ruiz-Velazco model is defined by the following equation:
 (5)
(5)
Where Wi is the initial weight and Wf is the final weight; parameter k represents the rate at which weight changes from its initial to its final value, and parameter c corresponds to the duration of the culture period in days (52). It was assumed that weight-at-age data follows a log-normal distribu-tion. Parameters were estimated by minimizing the negative log-likelihood (−LL) (Haddon, 2001).
 (6)
(6)
Where
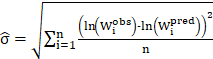
Where  is the observed
weight-at-age,
is the observed
weight-at-age,  is the
predicted weight-at-age, and n is the number of observations. For model
selection, the Akaike Information Criterion (AIC) (Akaike, 1973) was used:
is the
predicted weight-at-age, and n is the number of observations. For model
selection, the Akaike Information Criterion (AIC) (Akaike, 1973) was used:
 (7)
(7)
Where k is the number of estimated parameters and −LL is the negative log-likelihood. The Akaike weight was also used for model comparison:
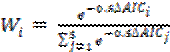
Where j is an index
representing each of the models used in the analysis (Equations 1–5) and  .
.
RESULTS Y DISCUSSION
The estimated mean survival was high in both treatments, reaching 90% for density D500 and 93% for density D1000, reflecting adequate culture conditions. Regarding environmental parameters, water temperature ranged between 24 and 29 °C, with means of 27.2 ± 1.24 °C (D500) and 27.4 ± 1.48 °C (D1000), remaining within the optimal range for bullfrog growth during the study period, according to the Servicio Nacional de Sanidad, Inocuidad y Calidad Agroalimentaria (SENASICA, 2019). Statistical analysis comparing tank temperatures using a t-test showed no significant differences between treatments (P = 0.3797).
Similarly, pH ranged from 6.4 to 7.0, with mean values of 6.6 ± 0.25 (D500) and 6.7 ± 0.21 (D1000), with no significant differences (P = 0.2193). These conditions allow the observed differences in growth to be attributed primarily to the effect of stocking density rather than environmental variation.
A total of 981 weight-at-age data points were recorded for D500 and 802 for D1000, yielding a total of 1,783 juveniles analyzed (Table 1). This sample size is adequate for evaluating growth using mathematical models, considering that most studies rely on a single dataset (Jurado-Molina et al., 2018).
For the final age class (52 days), density D1000 exhibited the highest weight values (76.18 ± 8.78 g) (Table 1 and Figure 1), suggesting better produc-tion performance under this condition. The results indicate that density D1000 promotes growth; however, this requires a more formal analysis using approaches such as those proposed by Jurado-Molina et al. (2023) and Ramos-Torres et al. (2024). The greater growth observed at the higher density could be explained by a reduction in motor activity due to limited space availability, which would decrease energy expenditure and promote greater feed utilization efficiency.
Table 1
Average weight-for-age and sample size data by culture density used to model the growth of juvenile bullfrogs grown in tanks
|
Age (days) |
Average weight (g) |
Data number (n) |
||
|
D500 |
D1000 |
D500 |
D1000 |
|
|
10 |
3.55 ± 2.13 |
3.09 ± 1.86 |
150 |
150 |
|
17 |
5.62 ± 3.06 |
4.21 ± 2.85 |
150 |
150 |
|
24 |
7.63 ± 4.47 |
6.32 ± 2.21 |
150 |
102 |
|
31 |
15.60 ± 6.18 |
14.79 ± 4.31 |
151 |
150 |
|
38 |
28.86 ± 2.80 |
37.57 ± 9.61 |
150 |
100 |
|
45 |
45.17 ± 4.99 |
55.17 ± 7.60 |
150 |
100 |
|
52 |
61.95 ± 5.40 |
76.18 ± 8.78 |
80 |
50 |
|
|
|
Total |
981 |
802 |
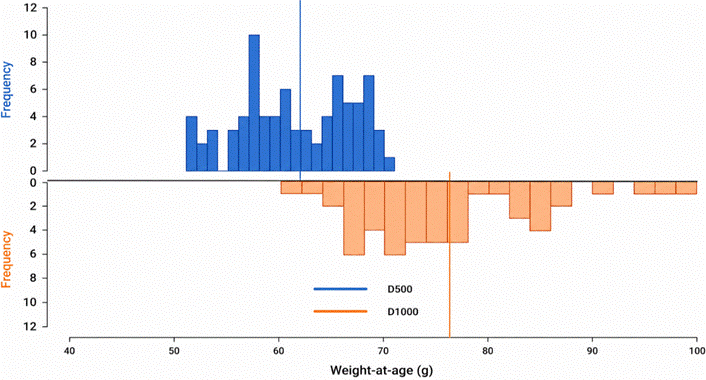
Figure 1. Size frequency distribution for juvenile bullfrogs cultured at two stocking densities during 52 days. The vertical line represents the average weight-at-age.
This finding is consistent with previous studies indicating that at higher stocking densities, growth can be maintained or even increased alongside biomass (Badillo-Zapata et al., 2022; Komal et al., 2024). However, caution is warranted, as over-crowding may lead to adverse effects on growth (Costa et al., 2017).
In the present study, five candidate weight-growth models were fitted (Equations 1–5). In general, all models adequately described the observed data, except at the final age class (52 days), where the Schnute model (Case 1) was the only one that achieved an adequate fit (Figures 2 and 3).
Estimates of the standard error (σ) were consistent across models and densities (Table 2), whereas parameters a and b showed considerable variation, with notably high values of a and negative values of b in the Schnute Case 1 model. Estimates of parameter k in the Ruiz-Velazco model were consistent between both densities, as were the initial weights.
Regarding final weight (W2), values were higher in D1000 and consistent across models, except for the Schnute Case 1 model (Table 2). From a methodological perspective, the selection of models incorporating parameter W2 represents an advantage over traditional models such as von Bertalanffy, logistic, or Gompertz, which rely on the asymptotic weight (W∞).
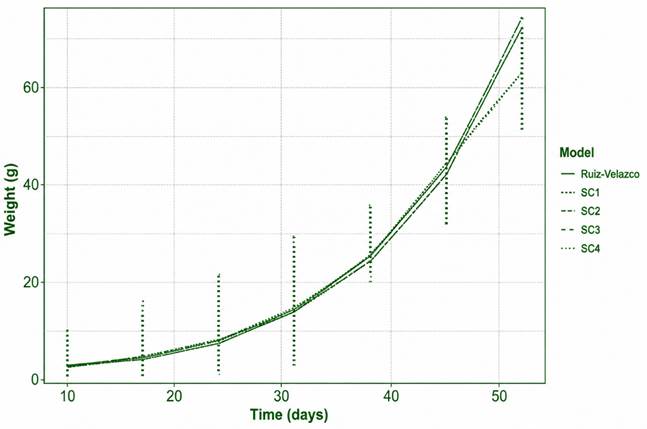
Figure 2. Fitting models to observed weight-at-age data for D500 density of pond-grown bullfrog juveniles. Ruiz-Velazco-Ruiz-Velazco model, SC1 – Schnute model case 1, SC2 - Schnute model case 2. SC3 - Schnute model case 3, SC4 - Schnute model case 4.
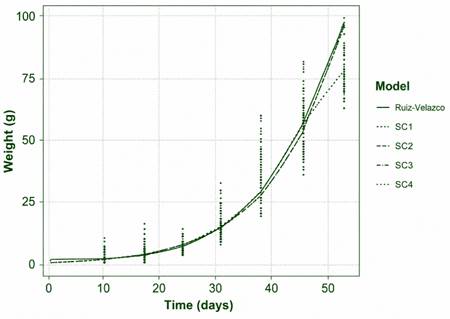
Figure 3. Fitting models to observed weight-at-age data for D1000 density of pond-grown bullfrog juveniles. Ruiz-Velazco-Ruiz-Velazco model, SC1 – Schnute model case 1, SC2 - Schnute model case 2. SC3 - Schnute model case 3, SC4 - Schnute model case 4.
Table 2
Estimated parameters for each candidate model assuming log-normal error for weight-at-age data at each density for tank-grown bullfrog juveniles
|
Density 500/m2 |
||||||
|
Model |
W1 |
W2 |
k |
a |
b |
Sigma |
|
RV |
2.7 ± 0.1 |
70.9 ± 2.8 |
1.007 ± 0.002 |
- |
- |
0.492 ± 0.011 |
|
Case 1 |
2.6 ± 0.1 |
61.9 ± 3.4 |
- |
0.5 ± 0.3 |
-6.2 ± 3.6 |
0.496 ± 0.011 |
|
Case 2 |
2.7 ± 0.1 |
72.7 ± 2.3 |
- |
8.2E-8 ± 9.3E-7 |
- |
0.499 ± 0.011 |
|
Case 3 |
2.70 ± 0.08 |
72.7 ± 2.3 |
- |
- |
1.5E-4 ±0.003 |
0.499 ± 0.011 |
|
Case 4 |
2.70 ± 0.08 |
72.7 ± 2.3 |
- |
- |
- |
0.499 ± 0.011 |
|
Density 1000/m2 |
||||||
|
RV |
2.2 ± 0.1 |
97.1 ± 4.2 |
1.015 ± 0.001 |
- |
- |
0.450 ± 0.011 |
|
Case 1 |
2.1 ± 0.1 |
75.8 ± 4.90 |
- |
0.63 ± 0.56 |
-6.67 ± 6.02 |
0.464 ± 0.012 |
|
Case 2 |
2.2 ± 0.1 |
96.3 ± 3.4 |
- |
2.6E-8 ± 3.6E-7 |
0.469 ± 0.012 |
|
|
Case 3 |
2.2 ± 0.1 |
96.3 ± 3.4 |
- |
- |
2.3E-5 ± 6.3E-4 |
0.469 ± 0.012 |
|
Case 4 |
2.2 ± 0.1 |
96.3 ± 3.4 |
- |
- |
- |
0.469 ± 0.012 |
The parameter W2 allows growth to be interpreted at a specific point in the culture period, such as the end of the experimental period (Schnute, 1981), which is more useful in aquaculture contexts. In this regard, understanding growth constitutes a key element for the success of aquaculture (Jurado-Molina et al., 2023).
Regarding model selection, the Ruiz-Velazco model provided the best fit at both stocking densities according to the Akaike Information Criterion (AIC). For D500, it yielded the lowest AIC value (1402.34), with Δi = 0 and an Akaike weight (wi) of 0.99, whereas the Schnute models showed Δi > 15 and wi < 0.001, indicating virtually no support.
For D1000, the Ruiz-Velazco model was also the most parsimonious (AIC = 1002.95, wi = 1), with Δi > 50 for the alternative models (Table 3). These results confirm that the Ruiz-Velazco model more adequately describes the weight-growth rela-tionship under both stocking density conditions.
However, although the Ruiz-Velazco model showed the best overall performance, it did not adequately reproduce the data for the final age class, in contrast to the Schnute Case 1 model. This highlights the importance of considering the objective of the analysis: while the Ruiz-Velazco model optimizes overall fit, the Schnute model may be more suitable for point predictions at the end of the culture period. Farm managers should take this distinction into account when making production decisions.
Table 3
Model selection using the Akaike criterion, Δi, and wi for the growth of tank-cultured bullfrogs at two different densities
|
Density |
Model |
AIC |
Δi |
wi |
|
D500 |
Ruiz Velazco |
1402.342 |
0 |
0.999 |
|
Schnute Case 1 |
1417.9643 |
15.6223 |
0.0004 |
|
|
Schnute Case 2 |
1428.3981 |
26.0561 |
2.19E-06 |
|
|
Schnute Case 3 |
1428.404 |
26.062 |
2.19E-06 |
|
|
Schnute Case 4 |
1426.398 |
24.056 |
5.97E-06 |
|
|
D1000 |
Ruiz Velazco |
1002.945 |
0 |
1 |
|
Schnute Case 1 |
1055.2891 |
52.3441 |
4.30153E-12 |
|
|
Schnute Case 2 |
1071.699 |
68.754 |
1.1756E-15 |
|
|
Schnute Case 3 |
1071.701 |
68.756 |
1.17442E-15 |
|
|
Schnute Case 4 |
1069.6985 |
66.7535 |
3.1964E-15 |
The Ruiz-Velazco model has previously been applied to juvenile bullfrogs (Hernández-López et al., 2024), where it did not always provide the best statistical fit, although its curve was similar to that of the optimal model. It has also demonstrated robust performance under commercial high-density conditions (Hernández-López & Hernández-Yau, 2023). This suggests that, although it is not always the optimal model, it adequately represents the general dynamics of growth.
The use of multiple models allows for the incorporation of model error, which arises when model structure or underlying assumptions represent a simplified version of reality and fail to capture its full complexity (Sun & Wang, 2024). Unlike the traditional approach in aquaculture, which is based on a single model (often the von Bertalanffy model), this study adopts a multimodel approach that reduces uncertainty and improves inference. This is particularly relevant given that the von Bertalanffy model may exhibit bias in parameter estimation and extrapolation (Flinn & Midway, 2021), despite its widespread use (Aragón-Noriega et al., 2025).
Several studies have shown that no single model is universally superior. For example, McGuigan et al. (2023) reported estimates using the von Bertalanffy model for Lutjanus campechanus, whereas Jurado-Molina et al. (2023) recommended the logistic model for Lutjanus guttatus. Other models, such as the triple logistic (Ramos-Torres et al., 2025) and the Weibull model (Zarzar et al., 2023), have also demonstrated good performance across different species. This reinforces the need to apply comparative approaches in growth analysis.
The present study represents a relevant contribution by incorporating model uncertainty into the analysis of bullfrog growth under commercial conditions. Additionally, the use of two stocking densities allows for a robust evaluation of model performance across different production scenarios.
From an applied perspective, the results indicate that the Ruiz-Velazco model provides useful estimates for planning the pre-grow-out stage. However, these estimates should be interpreted with caution, as they may change when incorporating data from larger individuals or complete production cycles. In this regard, future studies could integrate Bayesian approaches to improve parameter estimation.
Overall, the results presented here aim to provide useful information for producers and aquaculture farm managers to optimize growth, improve profitability, and enhance the technical viability of production. This study represents a step forward in understanding bullfrog growth under culture conditions and highlights the importance of accounting for model uncertainty through the evaluation of multiple candidate models.
CONCLUSIONS
This study demonstrates that the Ruiz-Velazco model is the most accurate and robust tool for predicting weight growth in juvenile bullfrog under commercial culture conditions in flow-through tank systems, outperforming traditional weight-growth models according to the AIC criterion. The implementation of a multimodel approach is essential to reduce bias in aquaculture planning and to optimize the grow-out stage under commercial and realistic stocking densities.
ACKNOWLEDGMENTS
The authors thank the staff of the aquaculture farm in southern Sinaloa for the space and material resources provided. They also thank fisheries engineers Cristian Iván Osuna Martínez y Juan Antonio Hernández Yau.
REFERENCES
Akaike, M. (1973). Information theory and an extension of the maximum likelihood principle. In: B. Petrov & F. Csáki (Eds.), Proceedings 2nd International Symposium of Information Theory. (pp.267-281). Budapest, Hungary: Akademia Kiado.
Akaike, H. (1981). Likelihood of a model and information criteria. Journal of Econometrics, 16(1), 3-14.
Aragón-Noriega, E. A., Alcántara-Razo, E., Félix-Ortiz, J. A., & Ayón-Jiménez, S. A. (2025). Individual growth parameterization models using the observer variance in organisms subject to aquaculture. Aquaculture Journal, 5(4), 21. https://doi.org/10.3390/aquacj5040021.
Badillo-Zapata, D., Tafoya-Sánchez, D., Vargas-Ceballos, M., Ruiz-González, L., Rodríguez-Montes de Oca, G., Palma-Cancino, D., & Vega-Villasante, F. (2022). Efecto de la densidad de siembra sobre el crecimiento y parámetros sanguíneos de Dormitator latifrons (Richardson, 1844). Ecosistemas y Recursos Agropecuarios, 9(3), 1-9. https://doi.org/10.19136/era.a9n3.3310
Castillo-Vargasmachuca, S., Ponce-Palafox, J., Arámbul-Muñoz, E., Rodríguez-Domínguez, G. & Aragón-Noriega, E. A. (2016). The spotted rose snapper (Lutjanus guttatus Steindachner 1869) farmed in marine cages: Review of growth models. Reviews in Aquaculture, 10(2), 376-384. https://doi.org/10.1111/raq.12166
CONAPESCA. Comisión Nacional de Acuacultura y Pesca. (2017). Ranicultura produce 228 toneladas anuales con valor superior a 10 mdp. https://www.gob.mx/conapesca/articulos/ranicultura-produce-228-toneladas-anuales-con-valor-superior-a-10-mdp.
Costa, A. A., Roubch, R., Dallago, B. S., Bueno, G. W., McManus, C., & Bernal, F. E. (2017). Influence of stocking density on growth performance and welfare of juvenile tilapia (Oreochromis niloticus) in cages. Arquivo Brasileiro de Medicina Veterinária e Zootencia, 69(1), 243-251. https://doi.org/10.1590/1678-4162-8939
Dodd, C., & Jennings, M. (2021). How to raise a bullfrog-The literature on frog farming in North America. Biblioteca Herpetologica, 15(8), 77-100.
FAO. (2022). The State of World Fisheries and Aquaculture 2022. Towards Blue Transformation. Rome, FAO. https://doi.org/10.4060/cc0461en
FAO. (2024). El estado mundial de la pesca y la acuicultura. La transformación azul en acción. Rome, FAO. https://doi.org/10.4060/cd0690es
FAO. (2025). Aquarana catesbeiana. Programa de información de especies acuáticas. Texto de Flores-Nava, A., En Pesca y acuicultura. Rome, FAO.
Flinn, S. A., & Midway, S. R. (2021). Trends in growth modeling in fisheries science. Fishes, 6(1), 1-18. https://doi:10.3390/fishes6010001
Fonseca-Madrigal, J., Andrade-López, T., Martínez-Palacios, C., Chávez-Sánchez, M., Olvera-Novoa, M., Navarrete-Ramírez, P., Raggi, L., Martínez-Chévez, C., Concha-Santos, S., & Ríos-Durán, M. (2023). Effect of dietary protein: lipid ratio on growth and body composition in bullfrog (Lithobates catesbeianus). Revista Brasileira de Zootecnia, 52, e20220104. https://doi.org/10.37496/rbz5220220104
Gompertz, B. (1825). On the nature of the function expressive of the law of human mortality and on a new mode determining the value of life contingences. Philosophical Transactions of the Royal Society of London, 115, 513-583. https://doi.org/10.1098/rspl.1815.0271
Haddon, M. (2001). Modelling and quantitative methods in fisheries. Boca Raton, FL: Chapman & Hall.
Hernández-Llamas, A., & Ratkowsky, D. (2004). Growth of fishes, crustaceans and molluscs: estimation of the von Bertalanffy, Logistic, Gompertz and Richards curves and a new growth model. Marine Ecology Progress Series, 282, 237-244. https://doi.org/10.3354/meps282237
Hernández-López, C.H., Martínez-Sánchez, H. F., Vázquez-Olivares, A. E., & Flores-Olivares, J. (2024). Bullfrog growth parameters in continuous water-flow tanks systems on a commercial scale. Intropica, 19(2). https://doi.org/10.21676/23897864.6198
Hernández-López, C. H., & Hernández-Yau, J. A. (2023). Crecimiento de juveniles de rana toro en estanques de flujo continuo de agua como alternativa de seguridad alimentaria de las comunidades pesqueras. Revista IPSUMTEC, 6(4), 74-68. https://doi.org/10.61117/ipsumtec.v6i4.365
Hernández-López, C. H., Hernández, C., Martínez-Cordero, F., Castañeda-Lomas, N., Rodríguez-Domínguez, G., & Tacon, A. (2016). Effect of density at harvest on the growth performance and profitability of hatchery-reared Spotted Rose Snapper, Lutjanus guttatus, cultured in floating net cages. Journal of the World Aquaculture Society, 47(1), 51-60. https://doi.org/10.1111/jwas.12253
Islas-Ojeda, E., García-Munguía, A., Chávez-González, L., López-Gutiérrez, M., Hernández-Valdivia, E., & García-Munguía, C. (2021). Producción sostenible de rana toro (Lithobates catesbeianus) con agua de reúso de un sistema Biofloc. Abanico veterinario, 11, e124. https://doi.org/10.21929/abavet2021.37
Jurado-Molina, J., Gutiérrez-Benítez, O., & Roldan-Heredia, A. (2018). Model uncertainty and Bayesian estimation of growth parameters of Yellowtail Snapper (Ocyurus chrysurus) from Veradruz, Mexico. Hidrobiológica, 28(2), 191-199. https://doi.org/10.24275/uam/izt/dcbs/hidro/2018v28n2/jurado
Jurado-Molina, J., Hernández-López, C. H., & Hernández, C. (2023). Evaluation of fish density influence on the growth of the spotted rose snapper reared in floating net cages using growth models and non-parametric tests. Ciencias Marinas, 49. https://doi.org/10.7773/cm.y2023.3253
Katsanevakis, S., & Maravelias, C. D. (2008). Modelling fish growth: multi-model inference as a better alternative to a prioro using von Bertalanffy equation. Fish and Fisheries, 9(2), 178-187. https://doi.org/10.1111/j.1467-2979.2008.00279.x
Komal, W., Fatima, S., Minahal, Q., & Liaqat, R. (2024). Investigating the optimun stocking density of tilapia (Oreochromis niloticus) for intensive production focused to in-pond raceway system. Science Progress, 107(2), 1-32. https://doi.org/10.1177/00368504241257128
McGuigan, C., Buchalla, Y., Tudela, C., Starkman, S., & Bennett, D. (2023). Using multi-model inference to determine the growth rates of red snapper, Lutjanus campechanus, through ontoneny. Aquaculture Reports, 32. https://doi.org/10.1016/j.aqrep.2023.101681
Ramos-Torres, B., Félix-Ortiz, J., Urías-Sotomayor, R., Rodríguez-Domínguez, G., Payán-Alejo, J., & Aragón-Noriega, A. (2025). Applying a triple logistic growth model to Penaeus vannamei farmed in earthen ponds at a commercial farm in the Gulf of California, México. Latin American Journal of Aquaculture Research, 53(1), 72-78. https://doi.org/10.3856/vol53-issue1-fulltext-3276
Ramos-Torres, B., Félix-Ortiz, J., Urías-Sotomayor, R., Rodríguez-Domínguez, G., Payán-Alejo, J., & Aragón-Noriega, A. (2024). Comparison of growth curves of the Pacific white shrimp Penaeus vannamei Boone, 1931 (Decapoda, Penaeidae) reared in earthen ponds with three different water sources. Crustaceana, 97, 1357-1371. https://doi.org/10.1163/15685403-bja10413
Ricker, W. E. (1975). Computation and interpretation of biological statistics of fish populations. Bulletin of the Fisheries Research Board of Canada, Bulletin, 191, 1-382. http://www.dfo-mpo.gc.ca/Library/1485.pdf
Ruiz-Haddad, L., Tejada-Ortigoza, V., Martín-del-Campo, S. T., Balderas-León, I., Morales-de-la-Peña, M., García-Amezquita, L. E., & Welti-Chanes, J. (2022). Evaluation of nutritional composition and technological functionality of whole American Bullfrog (Lithobates catesbeianus), its skin, and leg as potential food ingredients. Food Chemistry, 372. https://doi.org/10.1016/j.foodchem.2021.131232.
Ruiz-Velazco, J. M., Hernández-Llamas, A., Gómez-Muñoz, V., & Magallón, F. (2010). Dynamics of intensive production of shrimp Litopenaeus vannamei affected by white spot disease. Aquaculture, 300(1-4), 113-119. https://doi.org/10.1016/j.aquaculture.2009.12.027
Schnute, J. (1981). A versatile growth model with statistically stable parameters. Canadian Journal of Fisheries and Aquatic Sciences, 38(9), 1128-1140. https://doi.org/10.1139/f81-153
Schnute, J. T., & Richards, L. J. (1990). A unified approach to the analysis of fish growth, maturity, and survivorship data. Canadian Journal of Fisheries and Aquatic Sciences, 47(1), 24-40. https://doi.org/10.1139/f90-003
SENASICA. Servicio Nacional de Sanidad, Inocuidad y Calidad Agroalimentaria 2019. Manual de buenas prácticas de producción acuícola de rana toro. www.gob.mx/senasica
Sun, X., & Wang, Y. (2024). Growth models in aquaculture for hybrid and natural groupers based on early development stage. Aquaculture, 578, 740026. https://doi.org/10.1016/j.aquaculture.2023.740026
Zarzar, C., Fernandes, T., & Cardoso-de-Oliveira, I. (2023). Modeling the growth of Pacific White shrimp (Litopenaeus vannamei) using the new Bayesian hierarchical approach base don correcting bias caused by incimplete or limited data. Ecological Informatics, 77, 102271. https://doi.org/10.1016/j.ecoinf.2023.102271
Zhang, K., Zhang, Y., Tian, Y., Xu, B., Jiang, X., Qin, Z., Liu, C., & Lin, L. (2025). A Chromosome-level genome assembly of the american bullfrogs (Rana catesbeiana). Scientific Data, 12(1), 1-8. https://doi.org/10.1038/s41597-025-04697-3
Zhang, C. X., Huang, K. K, Wang, L., Song, K., Zhang, L., & Li, P. (2015). Apparent digestibility coefficients and amino acid availability of common protein ingredients in the diets of bullfrog, Rana (Lithobates) catesbeiana. Aquaculture, 437, 38-45. https://doi.org/10.1016/j.aquaculture.2014.11.015